Hello Olivier,
Thank you for the example.
Both of these behaviors seem to me to be bugs. Ferret should draw the same time-axis style for a given time range, regardless of the length of the axis line on the page; and it should be filling in the shade plots back to the start of the time axis. We will look into all of this.
Ansley
On 12/20/2017 2:17 AM, Olivier Marti
wrote:
Hi everybody
The following has been tested on Ferret 7.1 on Mac OSX 10.12, Ferret 6.9.3 on RedHat 2.6.32 and PyFerret 7.1 on RedHat 2.6.32
Several questions :
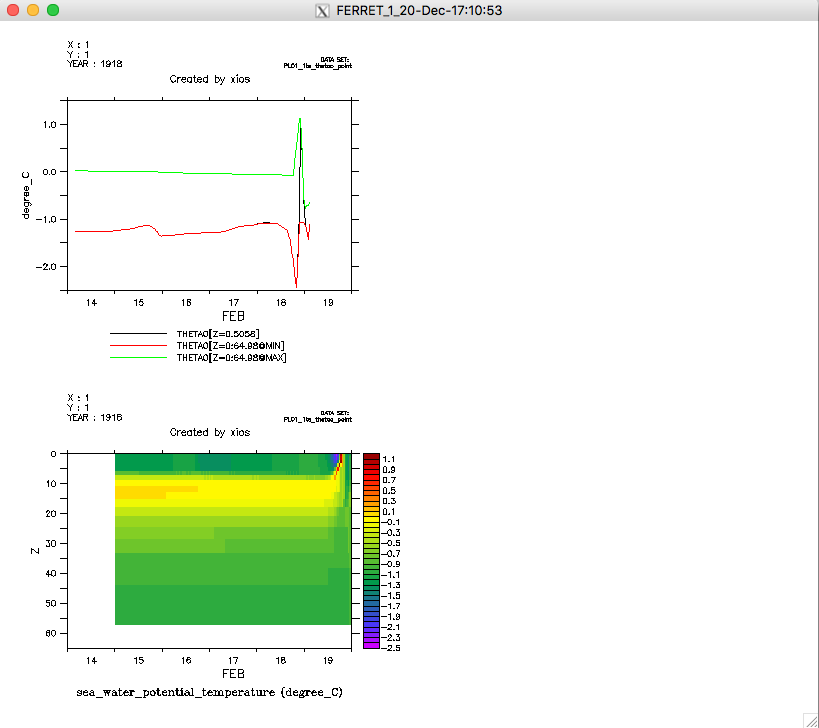
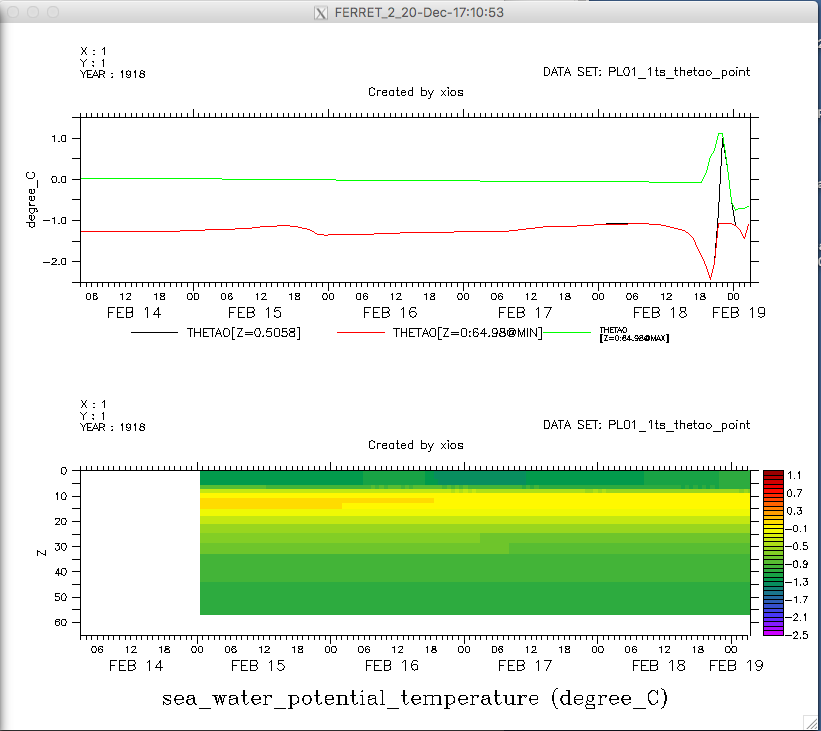
- Why PLOT and SHADE do not show the same time axes ?- Why is there a empty part on the right of the PLOT ?- Why is there a empty part on the left on the SHADE ?- Why the SHADE is cropped on the right part ?- Why this behavior is depending on the viewport definition ?
But the real question is : can I find a workaround to have matching time axes between SHADE and PLOT ?
Thank you for any kind of help !
Olivier
USE "https://vesg.ipsl.upmc.fr/thredds/dodsC/work_thredds/p86mart/FERRET_DEBUG/PL01_1ts_thetao_point.nc"
CANCEL WINDOW/ALL
SET WINDOW 1DEFINE VIEWPORT/X=0.0,0.5/Y=0.5,1.0 v1DEFINE VIEWPORT/X=0.0,0.5/Y=0.0,0.5 v2
SET VIEW v1 ; PLOT/K=1:20/LINE thetao[K=1], thetao[K=@MIN], thetao[K=@MAX]SET VIEW v2 ; SHADE/K=1:20 thetao
SET WINDOW 2DEFINE VIEWPORT/X=0.0,1.0/Y=0.5,1.0 v1DEFINE VIEWPORT/X=0.0,1.0/Y=0.0,0.5 v2
SET VIEW v1 ; PLOT/K=1:20/LINE thetao[K=1], thetao[K=@MIN], thetao[K=@MAX]SET VIEW v2 ; SHADE/K=1:20 thetao
--Laboratoire des Sciences du Climat et de l'EnvironnementInstitut Pierre Simon LaplaceLaboratoire CEA-CNRS-UVSQ - UMR 8212Tel : +33 1 69 08 77 27 - Mob : +33 6 45 36 43 74Fax : +33 1 69 08 30 73