|
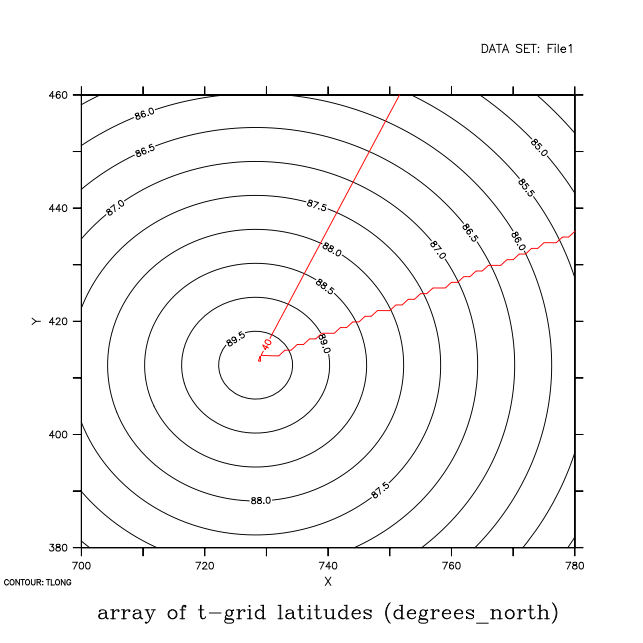
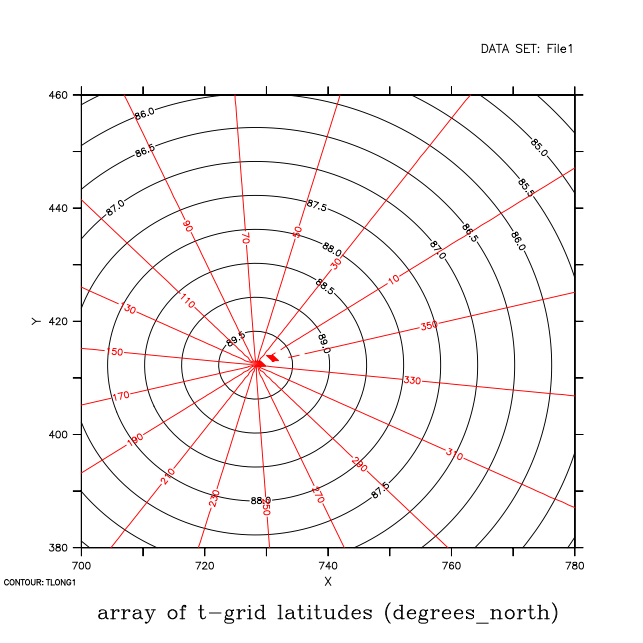
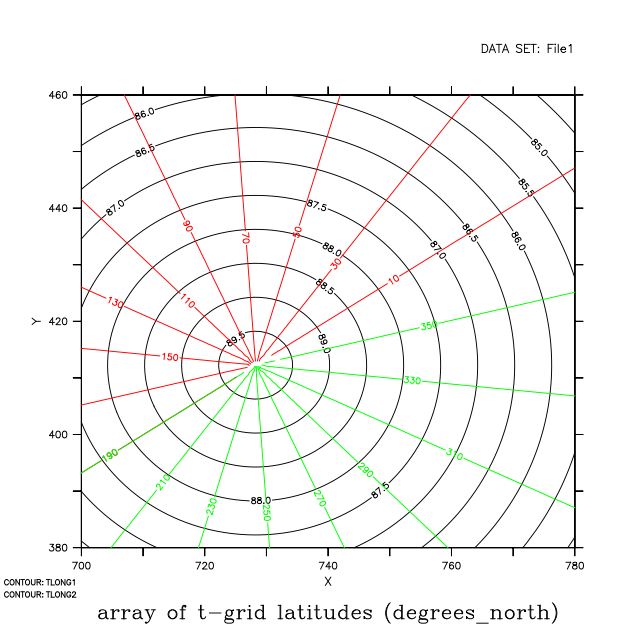
Hi, This is because of the discontinuity in the longitudes, where they change from 0 to 360. The thicker wiggling line you see is all of the contour lines being interpolated across that discontinuity. In a SHADE plot of "tlong" you can see the sharp break between 0 and 360, right where that line is. Try just one contour level: set data File1.ncyou can see that it has drawn the line that you want, along y=40, but then there is another where the contouring method is interpolating to find where there are values of 40 lying, for instance, between adjoining values of 0.2 and 359.75. There is no direct way to prevent this, but we can define new variables which avoid the issue. Define another variable that does not include the branch cut. My first try was to define a longitude variable with values only in 5 to 355, and contour that. It's pretty good. (Do "SHADE tlong1" to see what's going on.) use File1.ncThere is still some extra contouring going on near the center. The data excluded isn't enough to prevent the same kind of interpolating where we don't want it. Another try, first contouring only a variable with values between 0 and 180, then a second with values between 180 and 360. contour tlat I've allowed all of these to be drawn using the default colors for plot/overlay plots, just to make it easy to see, but of course you would use PLOT/OVER/NOLABEL/COLOR=black -Ansley On 12/3/2017 11:30 PM, niciej wrote:q
|
Attachment:
plot1.png
Description: PNG image
Attachment:
plot2.png
Description: PNG image
Attachment:
plot3.png
Description: PNG image