Hi
You can use /HLIMITS to set the start and end points on the horizontal axis (and /VLIMITS for the vertical axis. )
Something like this should work - using the correct values for your data of course.use etopo60Overlays like "go land" or "go fland" work as long as the coordinate-axis units are ones understood by Ferret and are compatible with the datasets used in the overlays, because Ferret gets the context from the drawing of the underlying plot.
shade/lev=c/pal=topo_blue_brown/hlim=360:150 rose[x=150:360,y=0:90]
go land
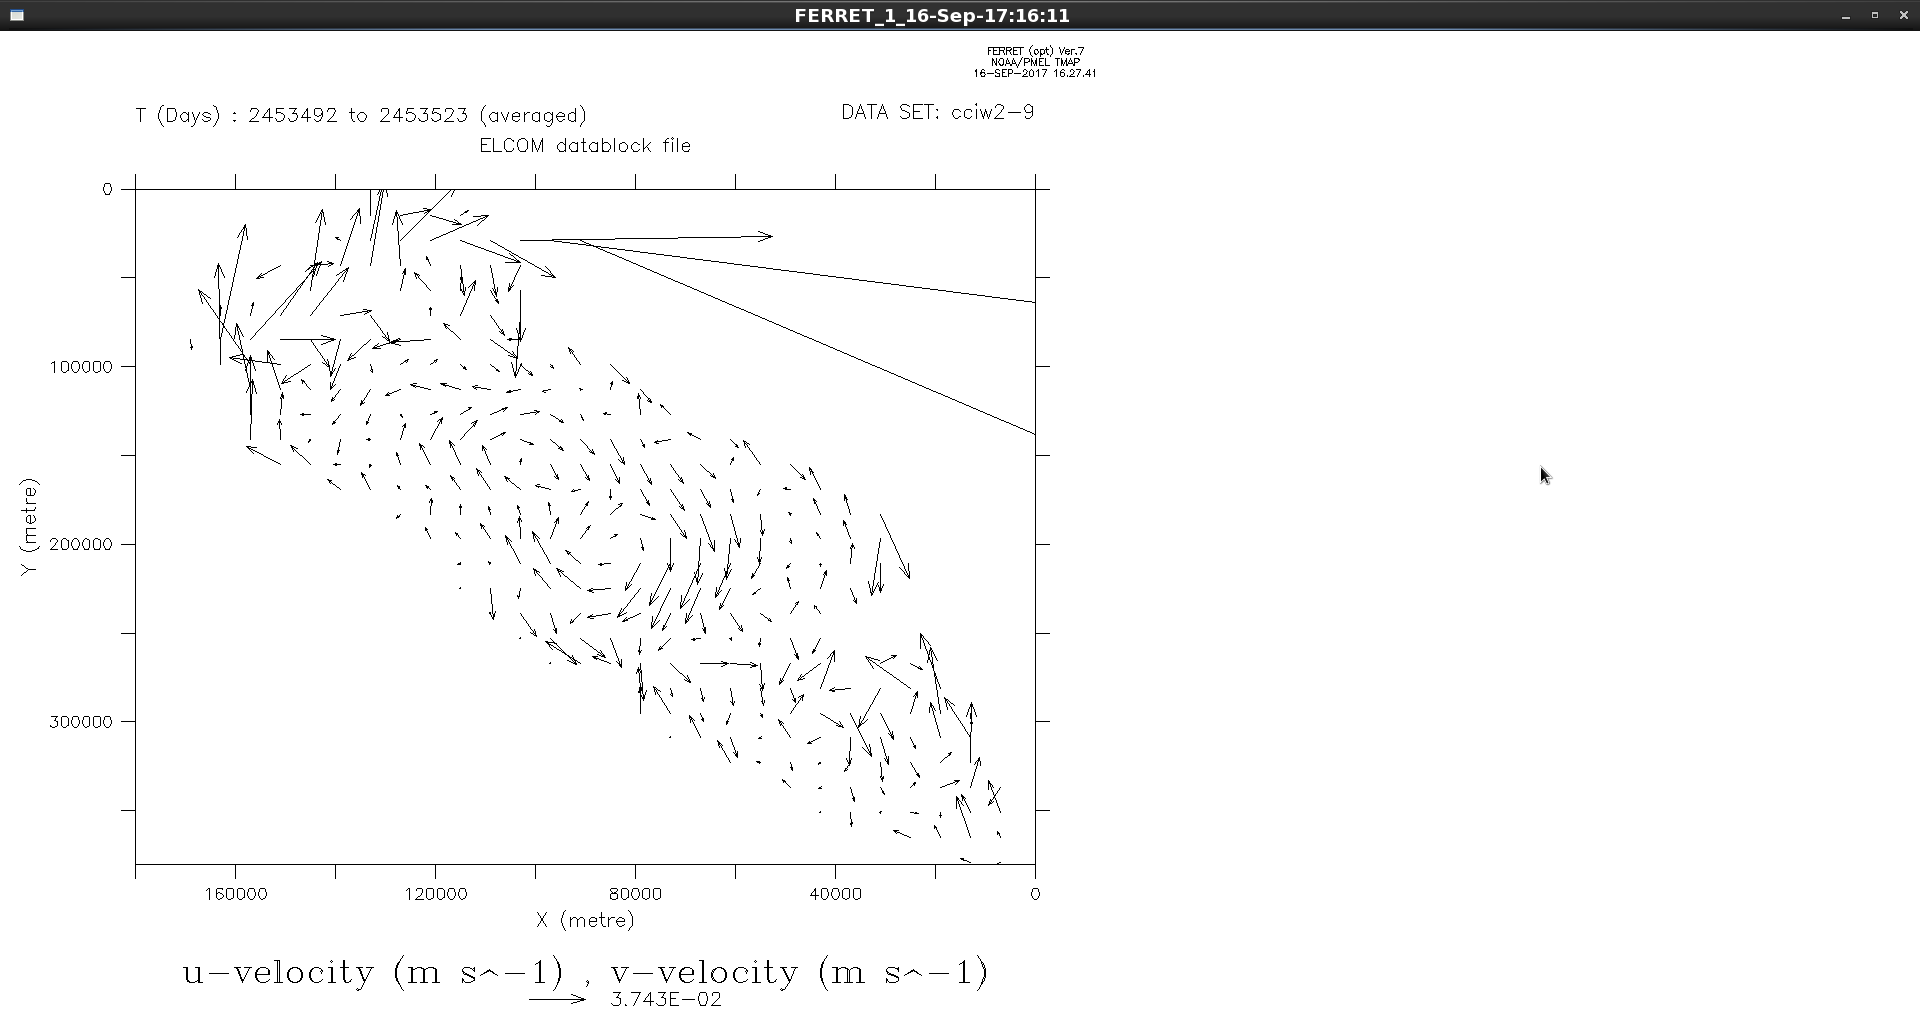
Hi,I searched the ferret forum but I couldn't find a code that turns the plot in fig 11111 to the plot in (Aug...). I mean just rotation and ignore other details. it seems that the second plot is the mirror plot of the first one. could you please give me a code for rotation so that I can get the second one?Thank you,Sara
Attachment:
2.png
Description: PNG image