[Thread Prev][Thread Next][Index]
Re: [ferret_users] Irregular depth from delimited file
- To: Ryo Furue <furue@xxxxxxxxxx>
- Subject: Re: [ferret_users] Irregular depth from delimited file
- From: Karnan C <karnanc6@xxxxxxxxx>
- Date: Mon, 28 Aug 2017 15:21:06 +0530
- Arc-authentication-results: i=4; mx.google.com; dkim=pass header.i=@gmail.com header.s=20161025 header.b=kJ9/V1Eq; arc=pass (i=2 dkim=pass dkdomain=gmail.com); spf=softfail (google.com: domain of transitioning karnanc6@xxxxxxxxx does not designate 52.222.5.176 as permitted sender) smtp.mailfrom=karnanc6@xxxxxxxxx; dmarc=pass (p=NONE sp=NONE dis=NONE) header.from=gmail.com
- Arc-authentication-results: i=3; mx.google.com; dkim=pass header.i=@gmail.com header.s=20161025 header.b=kJ9/V1Eq; arc=pass (i=2 dkim=pass dkdomain=gmail.com); spf=softfail (google.com: domain of transitioning karnanc6@xxxxxxxxx does not designate 52.222.5.176 as permitted sender) smtp.mailfrom=karnanc6@xxxxxxxxx; dmarc=pass (p=NONE sp=NONE dis=NONE) header.from=gmail.com
- Arc-authentication-results: i=2; mx.google.com; dkim=pass header.i=@gmail.com header.s=20161025 header.b=kJ9/V1Eq; arc=pass (i=1 spf=pass spfdomain=gmail.com dkim=pass dkdomain=gmail.com dmarc=pass fromdomain=gmail.com); spf=softfail (google.com: domain of transitioning karnanc6@xxxxxxxxx does not designate 65.127.216.230 as permitted sender) smtp.mailfrom=karnanc6@xxxxxxxxx
- Arc-authentication-results: i=1; mx.google.com; dkim=pass header.i=@gmail.com header.s=20161025 header.b=kJ9/V1Eq; spf=pass (google.com: domain of karnanc6@xxxxxxxxx designates 2a00:1450:400c:c09::231 as permitted sender) smtp.mailfrom=karnanc6@xxxxxxxxx; dmarc=pass (p=NONE sp=NONE dis=NONE) header.from=gmail.com
- Arc-message-signature: i=4; a=rsa-sha256; c=relaxed/relaxed; d=google.com; s=arc-20160816; h=list-archive:list-help:list-post:list-id:mailing-list:precedence:cc :to:subject:date:from:references:in-reply-to:mime-version :arc-authentication-results:arc-message-signature :arc-authentication-results:arc-message-signature:message-id :arc-authentication-results:arc-message-signature:dkim-signature :arc-authentication-results; bh=Zki19UoO3b1+RMX4ncHeEQpmBZAB0GTEyMGgoYxKZ20=; b=camPAX6woBjvWg65mmhDzIRPZLR/CJ9sbGjHRFIkJQc9wYFOUQqkWvwIgSrJ5eemUj LrELH1Niuk1phH0mLX04vzX7MqqpHaZ4TYcnIlL8qRI5Tydnt/UJ4uwRrsXPA8i+l8pe Ol/1zxnG9jJ4LmDmwrrAq374UYnu/uPzNWlziaN50SWI2uxX6Rn2gDgB3mYNeVTXYpSk SyEnrtvX6+gEXb7FOE7bSpiYQgd7IP7I+K4HG1q+BISVS/FlxcnnIxevNutlVi1nUfs8 6BK92OpANcJhcsfdK2vTb/RfRzTkyU4noOSMyLhQX6kexYfcdDYe9UZDzLMaxrRBPmnh mtlQ==
- Arc-message-signature: i=3; a=rsa-sha256; c=relaxed/relaxed; d=google.com; s=arc-20160816; h=cc:to:subject:date:from:references:in-reply-to:mime-version :dkim-signature:arc-authentication-results:arc-message-signature :arc-authentication-results:arc-message-signature:message-id :arc-authentication-results; bh=Zki19UoO3b1+RMX4ncHeEQpmBZAB0GTEyMGgoYxKZ20=; b=sctGwV31hRKH1cfI1e7U6PYUbwmiIxj8JBSuY9TzuaCU3aF/AmEEzgTGWNPWl8Zr0L +YcPqxAHnwc15H1cxPJNDn6TwWfV8c8Pio+lHzZO8P6MGNEfzR2YuwTs3i2pxAz8C6gZ pIlInGF8WsbG1BwWJYVPyByTYRs0P/uHyQRdIzqV7T2UA/cdNvUfP9AV0DD82DRWBpeC UetC/t2z3e/amAzrHUE3xt9M4SCIQ58me/YOP8CHANgYdHKOzzwk0XnLIbm2vQp5Wj8+ 6sp378UDtXAzHC5pDtz1tulyeCL9AOY2Wjb7kpCMqpwI+Jvkr9w1qLn5OSfRKnJ+67IJ MBtg==
- Arc-message-signature: i=2; a=rsa-sha256; c=relaxed/relaxed; d=google.com; s=arc-20160816; h=cc:to:subject:message-id:date:from:references:in-reply-to :mime-version:dkim-signature:arc-authentication-results :arc-message-signature:arc-authentication-results; bh=Zki19UoO3b1+RMX4ncHeEQpmBZAB0GTEyMGgoYxKZ20=; b=1FubrwXPUZX8GbEnLuRCbW/jvazyoFKRXsHzLI8UiobIR2aLTUr+zOzGzchUM6XKaI kLPuC3lNNGPIHLpM1h4ud3PZvDDyvGK/htzeRVZsrnFOSi+b5Wyd/sUcqV2rLE40AldC p1aGVMvl6/0PftEL+Vv0t31wPXQ1busgMd9+SBvG5aNAUwbmC1I24C7xJdKJQdGwqQf8 JvGLYEhfGeXk4eB/fet3LiapEvxRqWHcMeJvSKbQq9J6BUuvGn3JnPsmCsAtgL1T147l 8vZ4o1/E4nxil0i3elVIkTHG0C9WsN6inPB/ey586kupptk2xg4q24n1JbAURl2KJMUn XMIg==
- Arc-message-signature: i=1; a=rsa-sha256; c=relaxed/relaxed; d=google.com; s=arc-20160816; h=cc:to:subject:message-id:date:from:references:in-reply-to :mime-version:dkim-signature:arc-authentication-results; bh=Zki19UoO3b1+RMX4ncHeEQpmBZAB0GTEyMGgoYxKZ20=; b=NX+vdLmyB+ZzgEcJJKsA87aoluEADmAQc2i7mcafkUHjPlLWD9yI4aFXmAf2ajfTY+ 7sys/pwLug8eNZYLUtBoKV2mEAbDvJ0IJgLmQ7EncAXmIX3l3z22VoOS+5zyPakVlufi Pm+y6Q5bXtJbvOMw2L+tEkuzR+0zxsL01StYXu7CJlSUv7RVLSEcleuC1MGdo0k+2yrY EotFdWC2NXKwO63Y7uIo3ae1+xrueT99++fqgIJVQqk/d/t7K7ZqoAgwoziYoBuo+SeS BHdncTQSE0q30dgOWZRubgsZvGPeW+IXP0WGbPk/6TSoAmPzdXIatbsL91wjYNhpDeZZ BxPw==
- Arc-seal: i=4; a=rsa-sha256; t=1503913949; cv=pass; d=google.com; s=arc-20160816; b=tZIF6eYc7jG6RlcLh02Ib0cOuDloOUnw23livtIu6R72bKTdZ88FvF6SNy7yG3/WXs MSB7jO83vNLWXu2OCyKbNsR1vliCNDOu7tsJOtq8N4+hiF+UsYiWliZaoPtLPaAspYvt DJbczmqf+RStAdRjHbqlqlVZSGYoFqP0b+CeVnac243z8kyGGQxtJI3YWNYUEKLcM6if j6q1p9Tcp9mptb+5kB+Enu4EMBJ6rOfintBRKormnDBRdcgrBDeK+O3+UesEAVA3l4Da JWo9jHR92N8Sb6YgCboWjVg7/ncQ4Ez0hZMcdZlITbpk4PPdAxCOqmvRyORc/v52Y4/E 7JfQ==
- Arc-seal: i=3; a=rsa-sha256; t=1503913948; cv=pass; d=google.com; s=arc-20160816; b=jdduBjrEzxxDVG1s4KSR/t89deruq3hDDqKTcPyX+PSrzeRbPn3O/+1ExGPGDM6HTw v3TVD5rV2jFTwLevm7t6WxcCx5c+xtRqZM2TR8ILdJm5KPLV8J14cPES40zf74dW5QC3 Soc1Fkri1MdWefukTlU7TqIllqmGnC4QVilUbNuy7kapZ/UK96wDzL7fsC4Ea5k1G6xS 9f8ZFm4DClqPKQKS9rnVjlGbqiUVpaMOsPQKsLNpUrqlUTs0QZlUHKHfj8F4MQ/oKnre JMif00/hRVEUIPFVjp/Pjgi6D5Mp36DPOtJOhlhKfe9v9ppyPDx4V6xHcJ6zO8I1iFmC 0BnQ==
- Arc-seal: i=2; a=rsa-sha256; t=1503913875; cv=pass; d=google.com; s=arc-20160816; b=OsLLPuW6ANeZvw4XjVgL5PO84FaDoy2sBhTyZTTsP2+VBxvaYMX4KYWB5Vfg+6TEK5 VZp99zLhdmJlwoD4co7SHojmHUNZcroTHXrPLq8nX0rgKreDv/cNFJ+Q1f/zqFSHokTU SxqzYCfos7Y6Sy+emJ1OGOcYht41HxmXx0ijT9ZdmTCDPuf3Ib9q8TcvldHvOtKWVw5L CVA8xsdgApFxfuLOEgKW8ul/dusTUDL0Shjpz/VwyDqX2DkyFDwiieGcFxA097Vtw6kN Qj1ymKqSNQ8/jQN0PdG2C+399khN1DlMG0V6KwxMk2yTXDTZEMJ+AvabncqEzmWyLJdq RtRA==
- Arc-seal: i=1; a=rsa-sha256; t=1503913869; cv=none; d=google.com; s=arc-20160816; b=ZaGgVRvKg19wKngNgXsBM+FPhirnCf51lX3DzAfDOqa/o9W7eCqV5Gx0OoXxnM1FYp DMWz5vx3sZJR8hhUEdRYpL0KVKNYr21oW483e6gABKxjDv/r25pFub2QQT4dMvSYGoKb sUcTOB+d2/TRZsEVAJsc+7BY0XpoizDXY5oGTf6iPSNNfCphYzrmrD6Y/MjQdZumJodh Oin6qjYDixrJr1mNRtFedbF6vZpLO8ccqpUo2POzcF0+j74rqTFIgmmBq/g2q+CVsaPE bPSWwjORganljP/PrDteoFKGccMdOyR2T1k0MlxalFxNZh0WydKwdRlPrfRl/2Hqp037 bC6Q==
- Cc: Ferret <ferret_users@xxxxxxxx>
- Dkim-signature: v=1; a=rsa-sha256; c=relaxed/relaxed; d=noaa-gov.20150623.gappssmtp.com; s=20150623; h=message-id:mime-version:in-reply-to:references:from:date:subject:to :cc:x-original-sender:x-original-authentication-results:precedence :mailing-list:list-id:list-post:list-help:list-archive; bh=Zki19UoO3b1+RMX4ncHeEQpmBZAB0GTEyMGgoYxKZ20=; b=rgCFjRcm3sCZkhldShGEH+AOrI7+IlZ63eRcUTQm2jMuQ8qDKsxv0y8g6NZLI2dfi0 HxVgrRpCaLk9QNrSwuyjX+1nmph2UMKfm0BFGXePznEA5JGW3LfdOqYfmN37DTujF7nr /Vui2hH1eC5UrwDEgDAZM86/1s0YDmG8rgE3YMXitHl6IDWebF3DCHqGf15g4TBRJ3+b i5GyX9uOvtsKE4eFdMO0M1QdK1x6vLcxPAu40PiO5R9BqBetiAubt2oJhzszo0jYIzCr EC+2FsYym5dfiFpVIMgErl38kMuC0VnGF1L/nHWFx9EjRvUWlF056i4aM9HvBL0AhoKl jkIA==
- In-reply-to: <CAEwQpaLRUech_kW3yJUBoc+eRF3p_MPC=WFEUMQ-P24xwvUQMw@mail.gmail.com>
- List-archive: <https://groups.google.com/a/noaa.gov/group/ferret_users/>
- List-help: <https://support.google.com/a/noaa.gov/bin/topic.py?topic=25838>, <mailto:ferret_users+help@noaa.gov>
- List-id: <ferret_users.noaa.gov>
- List-post: <https://groups.google.com/a/noaa.gov/group/ferret_users/post>, <mailto:ferret_users@noaa.gov>
- Mailing-list: list ferret_users@xxxxxxxx; contact ferret_users+owners@xxxxxxxx
- References: <CAFYXeb8e3wvxur=k+MVK=2inTaH74aw_4YsFFnP+W+HOs0EW0Q@mail.gmail.com> <CAEwQpaLRUech_kW3yJUBoc+eRF3p_MPC=WFEUMQ-P24xwvUQMw@mail.gmail.com>
- Sender: owner-ferret_users@xxxxxxxx
Dear ferret_users,
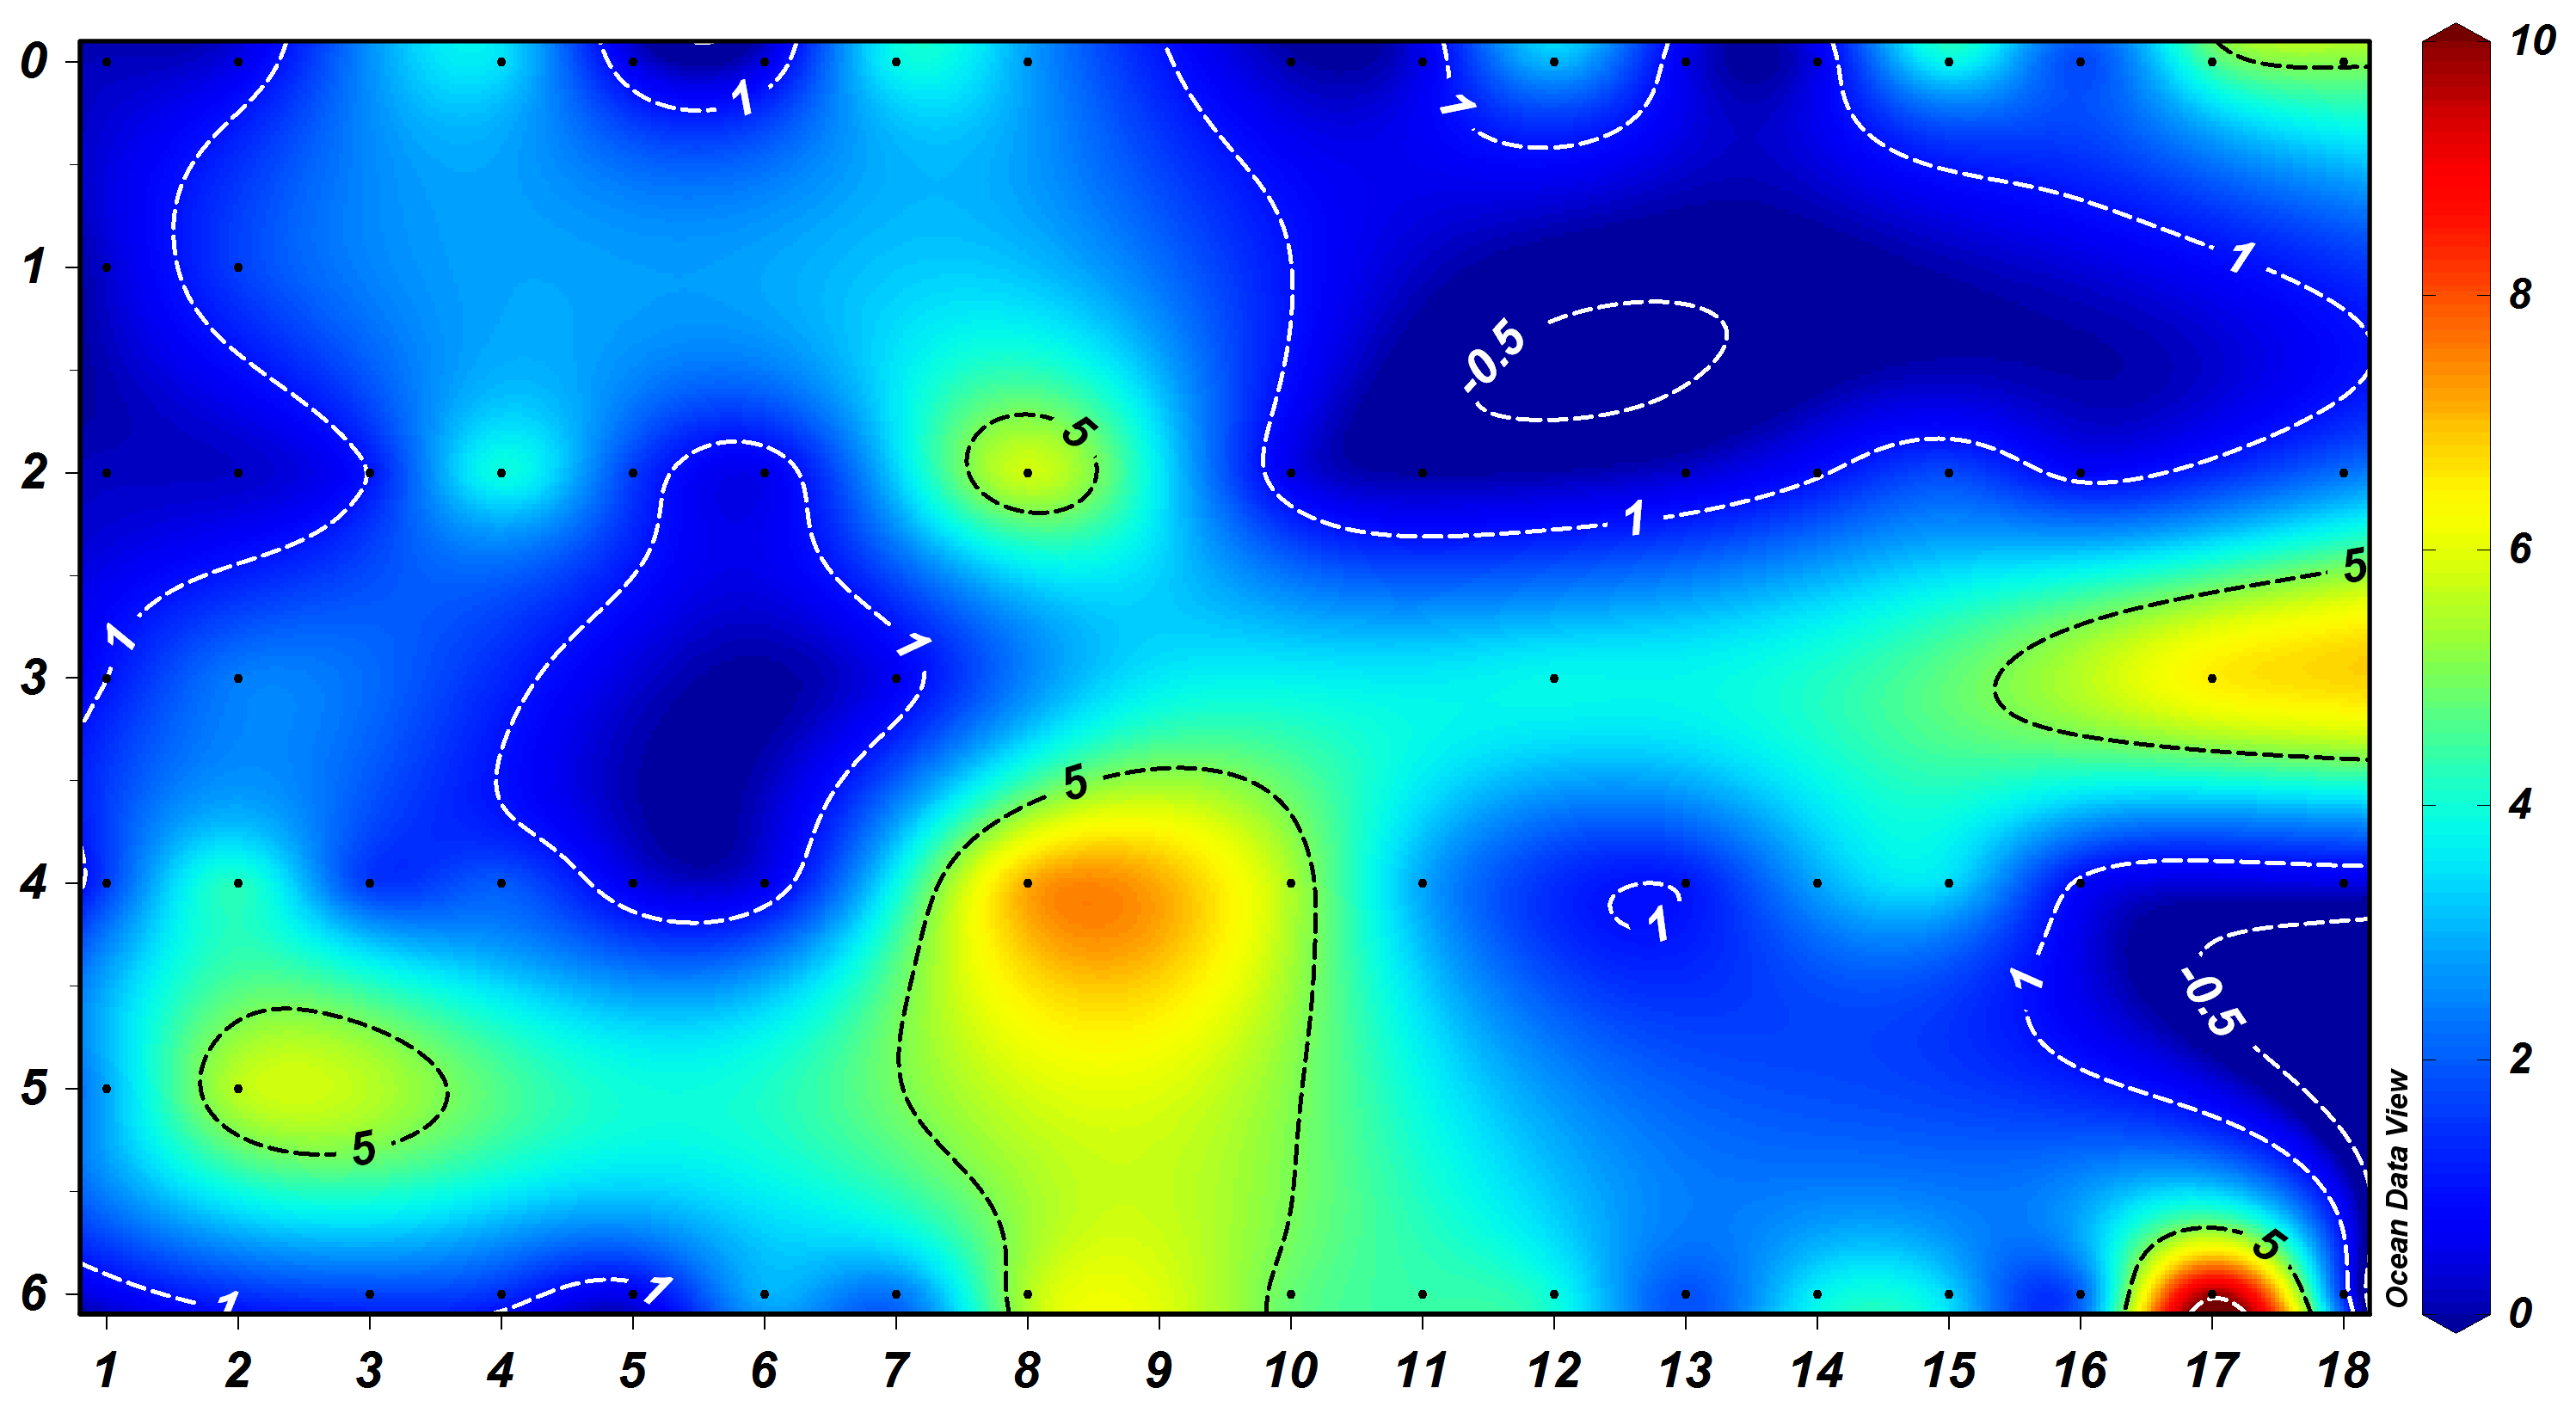
I don't get any idea to define my data and plot it properly. Here I
have attached one set of data (Ratios.xlsx) and the expected to plot a
time series vertical section plot (similar to attached image;
plotodv.png).
I don't have enough knowledge on irregular data plot from xls format.
Please someone help me,
Thank you.
My data looks like,
Latitude Longitude Depth Collection NP NS SP
9.4915 76.3140 0 1 0.196 0.007 27.216
9.4915 76.3140 1 1 0.170 0.007 23.283
9.4915 76.3140 2 1 0.232 0.010 22.161
9.4915 76.3140 3 1 0.877 0.044 19.877
9.4915 76.3140 4 1 1.163 0.048 24.070
9.4915 76.3140 5 1 2.621 0.168 15.603
9.4915 76.3140 0 2 0.226 0.006 35.194
9.4915 76.3140 1 2 1.711 0.049 34.921
9.4915 76.3140 2 2 0.171 0.005 31.857
9.4915 76.3140 3 2 2.585 0.071 36.463
9.4915 76.3140 4 2 5.291 0.193 27.364
9.4915 76.3140 5 2 5.987 0.226 26.493
9.4915 76.3140 0 3 ND ND 24.735
9.4915 76.3140 2 3 0.300 0.012 24.588
9.4915 76.3140 4 3 0.356 0.023 15.620
9.4915 76.3140 6 3 1.606 0.242 6.640
9.4915 76.3140 0 4 3.913 0.087 44.864
9.4915 76.3140 2 4 5.093 0.147 34.744
9.4915 76.3140 4 4 2.608 0.089 29.463
9.4915 76.3140 6 4 1.655 0.086 19.165
9.4915 76.3140 0 5 0.160 0.016 9.915
9.4915 76.3140 2 5 1.250 0.077 16.281
=======================================================================
Thanks you.
Regards,
Karnan C.
======================================
2017-08-25 11:17 GMT+05:30, Ryo Furue <furue@xxxxxxxxxx>:
> Hi Karnan,
>
> I have to generate a time series vertical plot of nutrient or any data.
>> In which I need y=depth and x=collection dates/numbers.
>> My delimited data set contains 5 columns such as depth, collection,
>> data1, data2, data3.
>> My collection is regular from 1 to 18 but the depths of each
>> collection were irregular.
>> I have tried with some earlier queries and methods.
>> I can define time axis (regular), but I can't find a solution for
>> depth (irregular).
>>
>
> I haven't looked at details of your data, but here is a snipped of the code
> to plot a depth-distance distribution of oxygen by regridding the the
> irregular depths to a regular grid:
>
> define axis/z=0:6000:100/depth/units="meters" depax ! New depth axis
> define axis/x . . . . horax
> define grid/x=horax/z=depax mygrid
> FILE/VAR="station,depth,oxygen"/GRID=mygrid/order=ZX oxygen.dat
> let oxy = ZAXREPLACE(oxygen, depth, z[gz=depax])
>
> The trick is ZAXREPLACE . See the Ferret manual.
>
> Hope this helps,
>
> Ryo
>
--
C. Karnan, CSIR - SRF
Ph. D Research Scholar
National Institute of Oceanography (CSIR)
Regional Centre, Dr Salim Ali Road
Kochi - 682 018.
India.
Mobile No. +91 9633032345; +91 9941811608
Attachment:
plotodv.png
Description: PNG image
Attachment:
Ratios.xlsx
Description: application/vnd.openxmlformats-officedocument.spreadsheetml.sheet
[Thread Prev][Thread Next][Index]
Contact Us
Dept of Commerce /
NOAA /
OAR /
PMEL /
Ferret
Privacy Policy | Disclaimer | Accessibility Statement