You can ask Ferret to use one extra grid-cell around the globe as it's drawing the plot. Using a dataset from the Ferret distribution,
yes? use monthly_navy_windsAnsley
yes? let clim = uwnd[t=1-jan-1989:31-dec-2008@ave]
yes? go mp_orthographic 90 -45
yes? set grid clim
yes? go mp_aspect
yes? LET masked_clim = clim * mp_mask
! Here is the gap you're seeing. The plot doesn't interpolate out to the edges of the cells at the
! ends of the x axis.
yes? FILL/NOAX/NOLAB masked_clim, x_page, y_page
! The curvilinear plot commands take into account a SET REGION setting,
! and because the grid is modulo in X, any setting with a range of 360 degrees
! will draw the plot you want:
yes? set region/x=0:360
yes? FILL/NOAX/NOLAB masked_clim, x_page, y_page
On 8/24/2017 8:57 PM, Roger Bodman
wrote:
Hi,
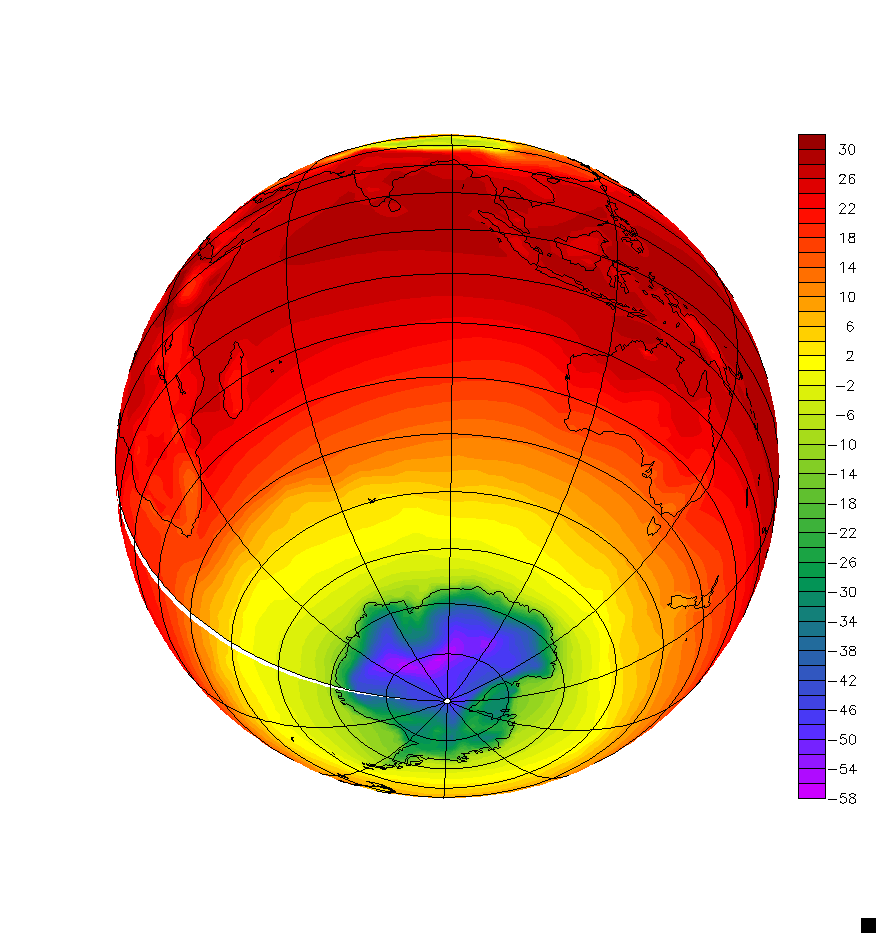
I have generated a plot, aj458_tas_test_map.gif, as attached using mp_hammer which looks ok. However, when I use mp_orthographic to generate a similar plot,aj458_tas_ortho_test.gif, it has a narrow white stripe. How do I avoid that?
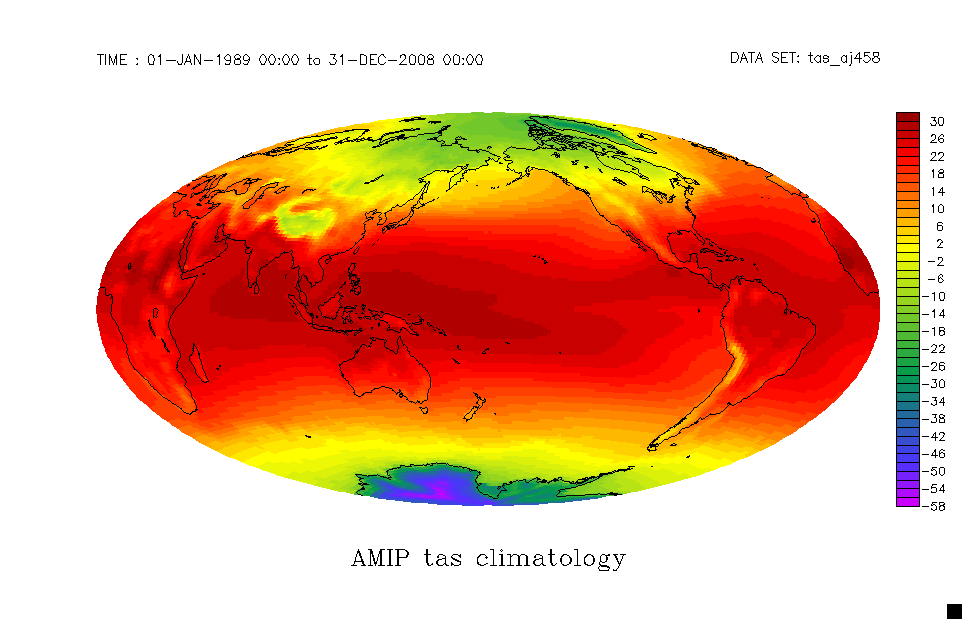
First plot:use "/Users/bodmanr/Desktop/Working_Suites/u-aj458/tas_aj458.nc"let clim = tas[t=1-jan-1989:31-dec-2008@ave] -273go mp_hammergo mp_grid climgo mp_aspectSHADE/NOAXIS/TITLE="AMIP tas climatology" clim*mp_mask, x_page, y_pagego mp_land.jnl
Second plot:use "/Users/bodmanr/Desktop/Working_Suites/u-aj458/tas_aj458.nc"let clim = tas[t=1-jan-1989:31-dec-2008@ave] -273go mp_orthographic 90 -45set grid climgo mp_aspectLET masked_clim = clim * mp_maskFILL/NOAX/NOLAB masked_clim, x_page, y_pagego mp_land
Thanks,
Roger Bodman
Research Fellow
The University of Melbourne,