Hi,
I'm trying to display a plot in Long,Lat coordinates and it doesn't seem to
matter if I use
SHADE/K=1/L=1 TEMP,TLONG,TLAT or
set REGION (to the one I want) or
set AXIS
The outcome is still odd (see attached).
The attached plot is generated from:
NOAA/PMEL TMAP
FERRET v6.85
Linux 2.6.32-358.23.2.el6.x86_64 64-bit - 11/12/13
13-Jun-17 20:13
yes? sh dat
currently SET data sets:
name title I J K L M N
TEMP Potential Temperature 1:501 1:271 1:42 1:132 ... ...
TLAT array of t-grid latitudes 1:501 1:271 ... ... ... ...
TLONG array of t-grid longitudes 1:501 1:271 ... ... ... ...
yes? shade/K=1/L=10 TEMP,TLONG,TLAT
I'm not even sure how to research this to find the answer. Help!
Thank you,
Judy
--
Judy Illeman Gaukel
Climate, Atmospheric Sciences, and Physical Oceanography
Scripps Institution of Oceanography
9500 Gilman Drive, 0230
La Jolla, CA 92093-0230
858-534-1863
judy@xxxxxxxx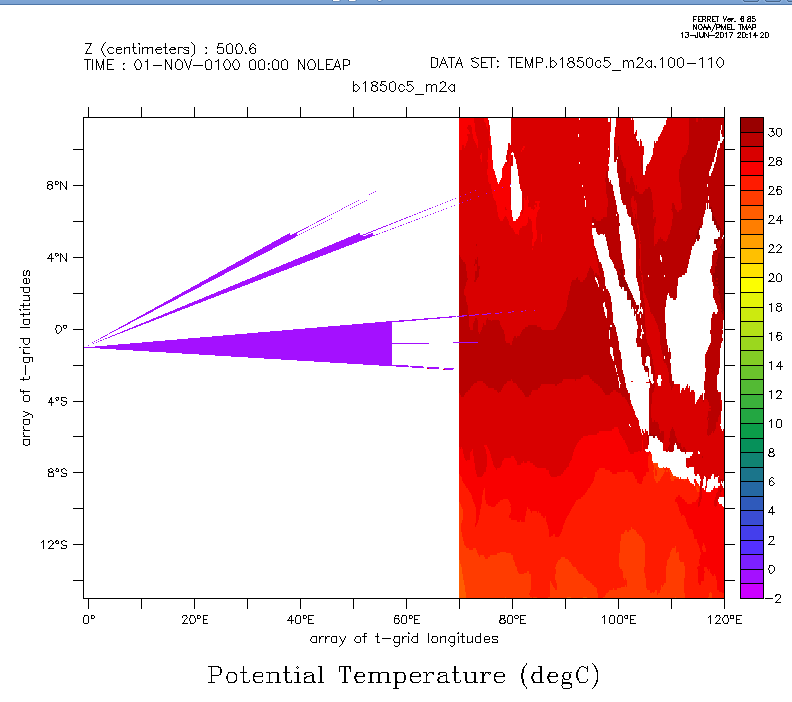