Hi all
I am trying to plot depth averaged climatology (which I have already calculated, not shown here) with the following
plot/thick=3/nolab/over oras4_clim[z=40:100@ave]
plot/nolab/over orap5_clim[z=40:100@ave]
plot/nolab/over godasop_clim[z=40:100@ave]
plot/nolab/over godasp1_clim[z=40:100@ave]
plot/nolab/over soda2_clim[z=40:100@ave]
plot/nolab/over soda3_clim[z=40:100@ave]
plot/nolab/over gfdl_clim[z=40:100@ave]
plot/nolab/over k7_clim[z=40:100@ave]
plot/nolab/over dask_clim[z=40:100@ave]
plot/thick=3/nolab/over ensemble_clim[z=40:100@ave]
go legend 1 "ORAS4" lr
go legend 2 "ORAP5" lr
go legend 3 "GODAOP" lr
go legend 4 "GODASP1" lr
go legend 5 "SODA2" lr
go legend 6 "SODA3" lr
go legend 7 "GFDL" lr
go legend 8 "K7" lr
go legend 9 "DASK" lr
go legend 10 "ENSEMBLE" lr
ppl plot
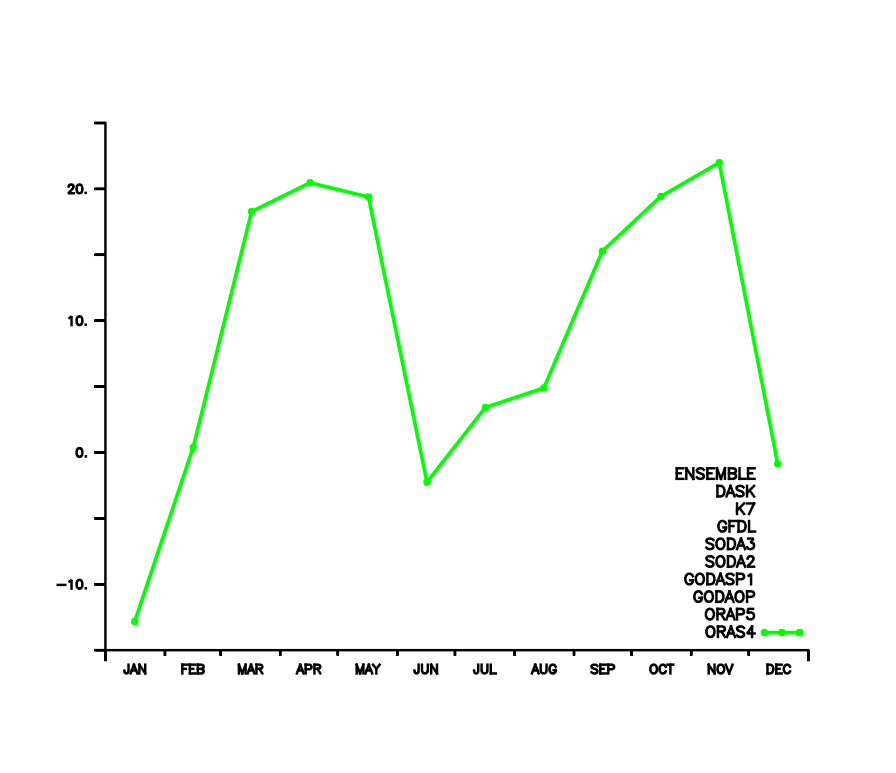
and what I am getting is the attached figure, which is the plot for only the ensemble