[Thread Prev][Thread Next][Index]

Re: [ferret_users] Creating irregular vertical axis


Hello again,

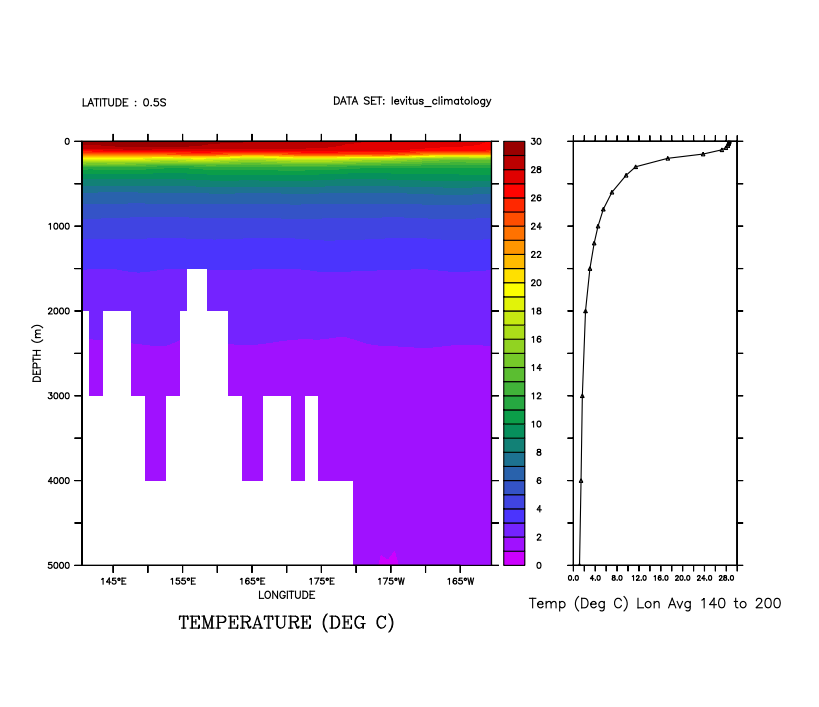
I had another thought about showing where the z-axis locations are.  Try this script, which first shows a fill plot like we've seen, using the Levitus_climatology dataset which has data on an irregular depth axis.  (I[m showing this in some detail to show the ANNOTATE command which some may not have used. ).

yes? cancel mode logo

! Define two viewports, one for the fill plot and a tall narrow one for a profile plot
yes? define viewport/x=0.1:0.6/y=0.2:0.8/axes v1
yes? define viewport/x=0.7:0.9/y=0.2:0.8/axes v2

yes? use levitus_climatology

! Draw a Z-X plot
yes? set v v1
yes? fill/y=0/x=140:200 temp

! Make a profile plot taking the average over the x range.  Remove the labels
! to keep it uncluttered and then add a title.

yes? set v v2
yes? plot/line/sym=19/siz=0.15/nolab/set  temp[y=0,x=140:200@ave]
yes? ppl axlabp,-1,0
yes? ppl plot

yes? annotate/norm/x=0.5/y=-0.1/halign=0 "Temp (Deg C) Lon Avg 140 to 200"
yes? frame/file=example1.png

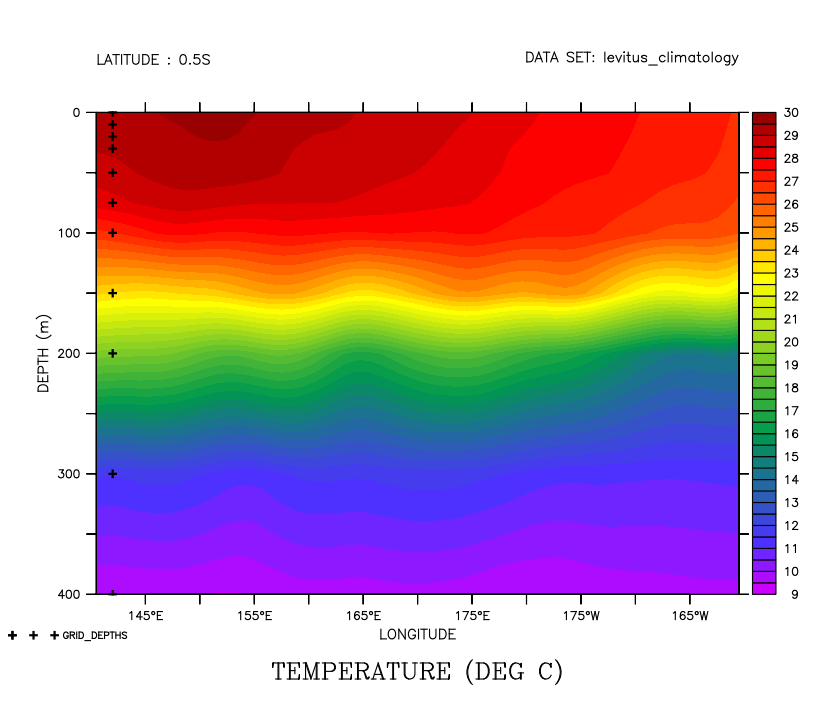
You could also just add a set of marks on the color plot that show where the gridpoints are:

yes? use levitus_climatology
yes? fill/y=0/x=140:200/z=0:500 temp

yes? let grid_depths = z[gz=temp]
yes? let xpts = 142 + 0*grid_depths
yes? plot/vs/over/thick/color=black/sym=4 xpts, grid_depths
yes? frame/file=example2.png

On 6/7/2017 10:37 AM, Ansley C. Manke wrote:

Hi,

We don't have a method to set irregularly spaced tic marks, other than for a log plot.  As far as I know, it is not standard to make tic marks that way.

You could mark the grid cell locations - just for example,

yes? DEFINE AXIS/Z/units=meters/depth zaxis = {1,5,10,15,30,45,60,70,100,150,200}
yes? let my_var = x[x=1:50:1] + z[gz=zaxis]

yes? ! remove the axis tics from the vertical axis
yes? fill/set/palette=grayscale my_var
yes? ppl yaxis,200,0,200
yes? ppl fill

yes? let zpts = z[gz=zaxis]
yes? let xpts = 1 + 0*z[gz=zaxis]

yes? plot/vs/over/color=lightblue/thick/symbol=25/nolab xpts, zpts


On 6/6/2017 9:09 PM, Krishnapriya M wrote:
Hi,
Can I make irregularly spaced tic marks in ferret fill plot?

With regards,
Krishnapriya

With Regards,
Krishnapriya M
Senior Research Fellow,
Ocean Integrated Biogeochemical Modeling Group(OIBM),
National Remote Sensing Centre (ISRO),
Balanagar,
Hyderabad-500037
Ph:040-23884576

On Tue, Jun 6, 2017 at 10:31 PM, Ansley C. Manke <ansley.b.manke@xxxxxxxx> wrote:
Hi,
The grid cells on the gird axis are irregular, but the tic marks on the plotted vertical axis will still be regularly spaced.  For example, define a synthetic variable,

yes? DEFINE AXIS/Z/units=meters/depth zaxis = {1,5,10,15,30,45,60,70,100,150,200}
yes? let my_var = x[x=1:50:1] + z[gz=zaxis]

yes? shade my_var
  
The plot is attached, and you can see the different sizes of the  grid cells. It's not as apparent with a FILL plot.

Ansley


On 6/6/2017 5:21 AM, Krishnapriya M wrote:
Hi Ansley,
I could not reply on time. Sorry for the delay. I tried this way also but again it is showing regular interval for Y-axis.Is there any other way to create similar plot?
With regards,
Krishnapriya

With Regards,
Krishnapriya M
Senior Research Fellow,
Ocean Integrated Biogeochemical Modeling Group(OIBM),
National Remote Sensing Centre (ISRO),
Balanagar,
Hyderabad-500037
Ph:040-23884576

On Mon, May 8, 2017 at 10:25 PM, Ansley C. Manke <ansley.b.manke@xxxxxxxx> wrote:

Hi,

Use DEFINE AXIS, for instance:

   DEFINE AXIS/Z/units=meters/depth zaxis = {1,5,10,15,30,45,60,70,100,150,200}

and regrid to that axis using @ASN, or use RESHAPE to put your data onto that axis.

Ansley


On 5/7/2017 11:48 PM, Nanda Kishore Reddy wrote:
Hi Priya,

You can use the zsequence command to create your irregular vertical axis and then regrid the data to your required region. I hope this can help you.

let depth=ZSEQUENCE({`1`,`5`,`10`,`15`,`30`,`45`,`60`,`70`,`100`,`150`,`200`}


With Kind Regards
B. Nanda Kishore Reddy,
PhD Scholar,
Department of Earth and Atmospheric Sciences(ER),
National Institute of Technology Rourkela

On Mon, May 8, 2017 at 10:56 AM, Krishnapriya M <mkrishnapriya11@xxxxxxxxx> wrote:
Hi all,
I would like to know whether there is any way to create an irregular vertical axis in a fill plot in ferret(for example, depth/pressure axis). Can anyone help on this?
 Thanks in advance

With Regards,
Krishnapriya M
Senior Research Fellow,
Ocean Integrated Biogeochemical Modeling Group(OIBM),
National Remote Sensing Centre (ISRO),
Balanagar,
Hyderabad-500037
Ph:040-23884576


Attachment: example1.png
Description: PNG image

Attachment: example2.png
Description: PNG image


[Thread Prev][Thread Next][Index]
Contact Us
Dept of Commerce / NOAA / OAR / PMEL / Ferret

Privacy Policy | Disclaimer | Accessibility Statement