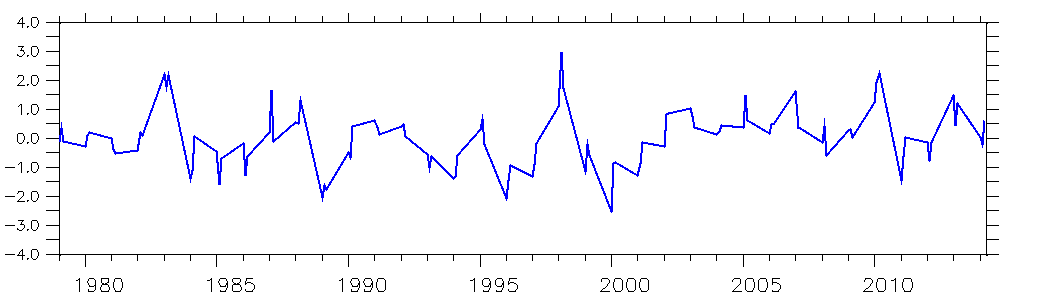
I would like to overlay a horizontal line on a time series at y=0 (see timeseries.png) however, this is being more difficult than I could have ever imagined.
Below is my script that generates a time series.
USE JFM_NCEP.nc
USE JFM_20th.nc
USE JFM_ERAINT.nc
! Compute and save the spatial EOF functions. These have the same units
! as the data.
LET eoftime = EOFSVD_TFUNC(hgt[X=10E:43E,Y=0:33S,k=12,d=1])*-1
LET eoftime2 = EOFSVD_TFUNC(hgt[X=10E:43E,Y=0:33S,k=14,d=2])*-1
LET eoftime3 = EOFSVD_TFUNC(hgt[X=10E:43E,Y=0:33S,d=3])*-1
!go multi_view [rows],[columns],[xsize],[xstart],[xgap],[ysize],[ystart],[ygap],[PRefix]
go multi_view 3, 1, 0.5, 0.1, 0.15, 0.25, 0.1, 0.07
SET WINDOW/ASPECT = .5
set view V11
PPL SHASET RESET
plot/nolab/color=blue/thick/I=1/TITLE="time function 1"/VLIMITS=-4.0:4.0:0.5 eoftime
--
"Try and Fail than to Fail to Try" - Israel Maoyi