|
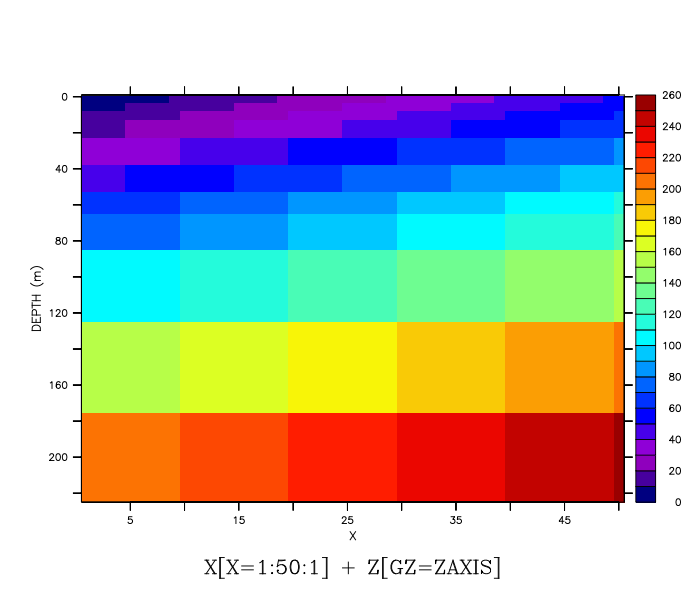
Hi, The grid cells on the gird axis are irregular, but the tic marks on the plotted vertical axis will still be regularly spaced. For example, define a synthetic variable, yes? DEFINE AXIS/Z/units=meters/depth zaxis = {1,5,10,15,30,45,60,70,100, yes? let my_var = x[x=1:50:1] + z[gz=zaxis] yes? shade my_var The plot is attached, and you can see the different sizes of the grid cells. It's not as apparent with a FILL plot. Ansley On 6/6/2017 5:21 AM, Krishnapriya M
wrote:
|
Attachment:
zaxis.png
Description: PNG image