|
Hi, Arijeet, You'll want to define a calendar axis, for instance here's a
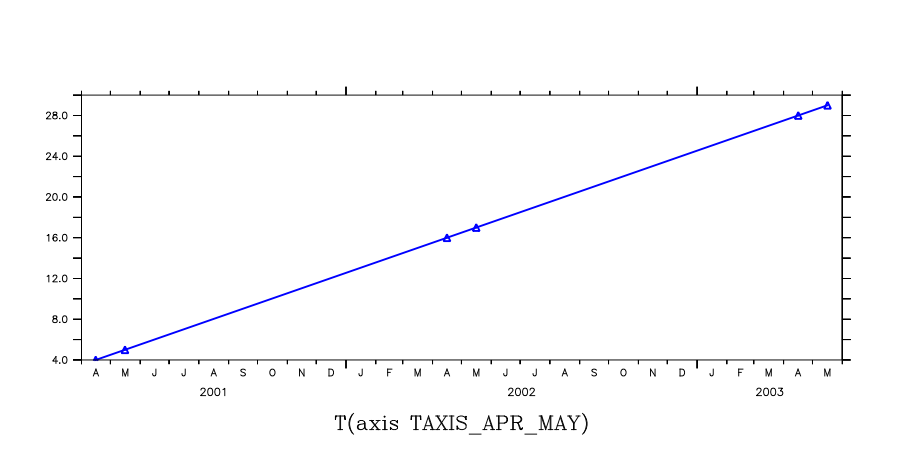
simple short one. You could use the MODULO function to define *** NOTE: /UNIT=MONTHS is ambiguous ... using 1/12 of 365.2425 days yes? show axis/t taxis_apr_may name axis # pts start end TAXIS_APR_MAY TIME 6 i 15-APR-2001 17:56 16-MAY-2003 16:03 T0 = 15-DEC-2000 Axis span (to cell edges) = 26 L T TBOX TBOXLO TSTEP (MONTHS) 1> 15-APR-2001 17:56:24 1 31-MAR-2001 12:41:51 4 2> 16-MAY-2001 04:25:30 6 30-APR-2001 23:10:57 5 3> 15-APR-2002 23:45:36 6 30-OCT-2001 14:05:33 16 4> 16-MAY-2002 10:14:42 6 01-MAY-2002 05:00:09 17 5> 16-APR-2003 05:34:48 6 30-OCT-2002 19:54:45 28 6> 16-MAY-2003 16:03:54 1 01-MAY-2003 10:49:21 29 This will be fine for plotting - see the attached image yes? let var2 = var[gt=taxis_apr_may@asn yes? plot/symbol=19/siz=0.2/line/thick/color=blue var2 But if you're doing any computation or comparisons with data on another time axis, you'd need to be careful. There are discussions of all this under "calendar" in the Ferret manual. It happens that I was just talking with somebody who was doing something similar. In the SHOW AXIS/T output above, look at the TBOX column. Notice that the first timestep has a TBOX size of 1 month while the rest, up to the last have a box size of 6 months. Ferret axes are contiguous, so that the upper grid-cell edge of each grid cell coincides with the lower cell limit of the next grid cell. Here, each April cell (after the first one) starts at the end of October or start of November the previous year, and ends at the end of April; the May cell starts at the start of May (or end of April) or and ends at the end of October the next year. For a regular axis like this, the "months" are equal fractions of a year, so the edges don't exactly meet up with the starts and ends of months. Here's a little sketch of what is going on, with coordinate locations at ---*--- and grid-cell edges shown by ---|--- A M J J A S O N D J F M A M J J A S O N D J F M A M J |-*-|-*---------------------|---------------------*-|-*---------------------|---------------------*-|-*---- This will be fine for just plotting your data, but if you do something like regrid this to a time axis with every month represented, maybe to compare values with another dataset, you'd want to be careful to use a transformation such as @NRST which will not take data from the May grid cell that lies in September and put it onto the monthly grid. Ansley On 5/16/2017 9:38 AM, Arijeet Dutta
wrote:
|
Attachment:
taxis.png
Description: PNG image