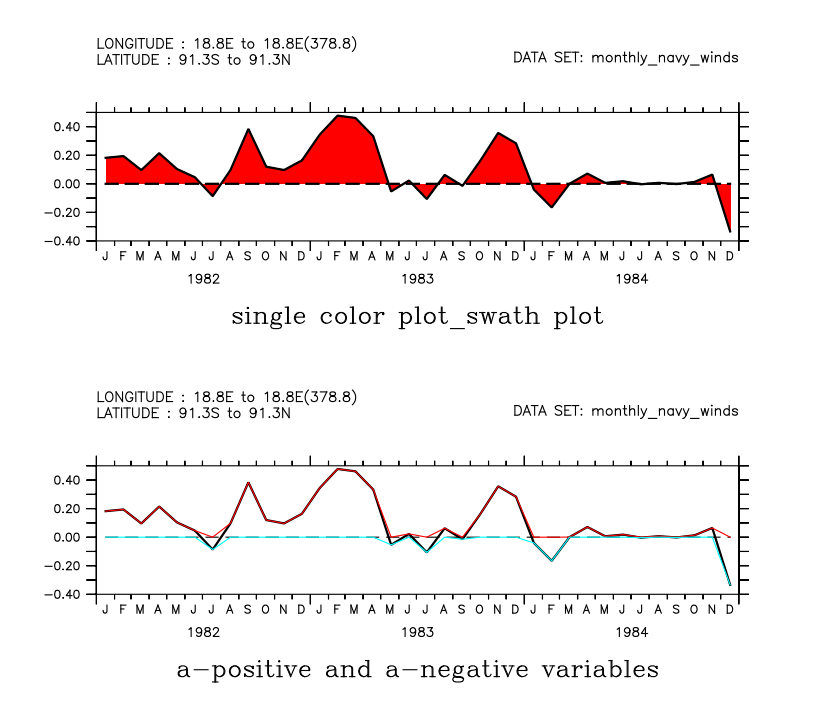
Hi Patrick,Yes, I see it now. A one-color plot with plot_swath.jnl is accurate, see the upper panel:
   let a = time_series
   let zero = 0*a

   set view upper
   plot/title="single color plot_swath plot" a
   go plot_swath poly/over/nolab/pal=red a, zero
but in order fill with different colors for positive and negative values means we make variable definitions that define lines that do not overlay variable a. Plot the variable the positive-only and negative-only values together (just sketching the plot commands):
   set view lower

   let a_pos =  if a ge 0 then a else 0
   let a_neg =  if a le 0 then a else 0
plot/color=black/thick/title="a-positive and a-negative variables" a, zero, a_pos, a_neg
The positive-only and negative-only lines do not match the original time series curve, so a call to plot_swath.jnl using these curves would not give accurate polygons. We would need to do more to define the right polygon edges.
-Ansley

On 3/22/2017 8:59 AM, Steve Hankin wrote:
Hi Patrick,They say, "You can't argue with success." But I am going to, anyway. ;-) Offering "2 cents" on this topic by way of discussion:The process of interpolating in a plane is inherently ambiguous. I don't think (agree?) that one can **in general** guarantee precise alignment of plot lines and contour paths. An alternative way that does ensure perfect accuracy is to use the segments of those lines, themselves, to define color-filled polygons. There are Ferret scripts that take this approach. Use of those scripts seems like the most reliable approach.- Steve ========================================== On 3/15/2017 12:58 PM, Patrick Brockmann wrote:Le Mercredi 15 Mars 2017 17.28 CET, "Patrick Brockmann" <patrick.brockmann@xxxxxxxxxxxx> a écrit:Hi ferreters, I am wondering if the accuracy of the filling could be improved in the following script. I should perhaps regrid to a finer time step but I am afraid to complicate the script unnecessary.I answer to my own question... With 2 additional lines, the problem is solved. No other way. My explanation. You need to define a finer axis time (days) and regrid the variable to it because the fills will be done by parts. Smaller they are, better the accuracy will be. Solet a0 = uwnd[i=@ave,j=@ave]-uwnd_clim[i=@ave,j=@ave,T="01-JAN-1982":"31-DEC-1992"]to be replaced bylet a0 = uwnd[i=@ave,j=@ave]-uwnd_clim[i=@ave,j=@ave,T="01-JAN-1982":"31-DEC-1992"]def axis/t="01-JAN-1982":"31-DEC-1992":1/units=days timeDays let a = a0[gt=timeDays] Happy ferreting. Patrick
Attachment:
plot_swath_example.png
Description: PNG image