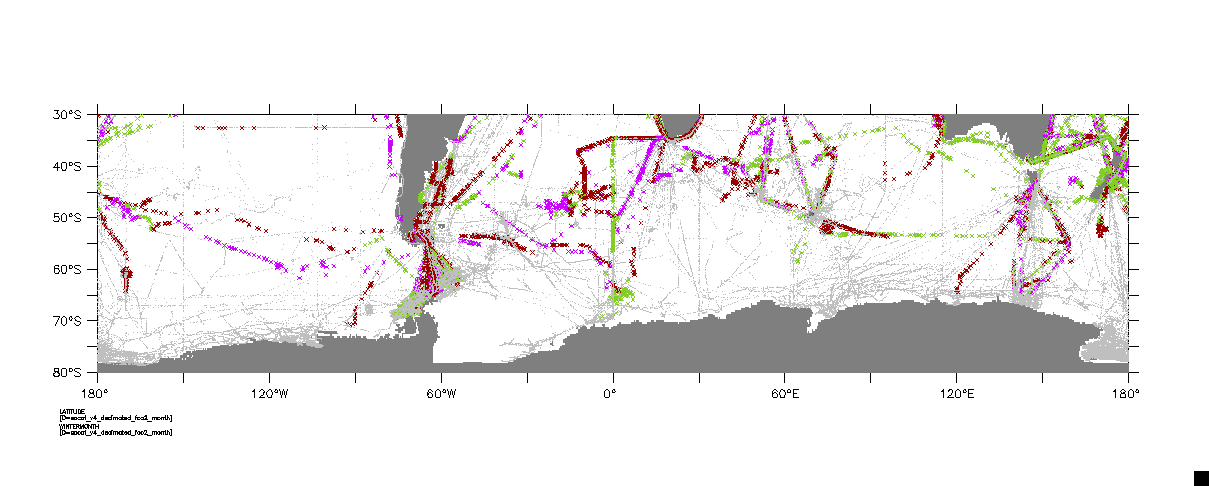
New ferret user here. How do I force a ribbon plot to NOT plot the gray dots for the values I have filtered out? In this case i'm filtering the SOCATv4 data by month. I only want to plot months 7, 8, and 9 (Austral winter) and for them to be colored by month (or all the same color would be fine).
let winter=if month gt6 and month lt 10 then 1
let wintermonth=month*winter
plot/vs/over/ribbon/missing=blank longitude, latitude, wintermonth

Thanks for your help!
--
Nancy Williams
Nancy.Williams@xxxxxxxxxxxxxxx
Graduate Student
College of Earth, Ocean, and Atmospheric Sciences
Oregon State University