hi ferreters,
happy new year to all !
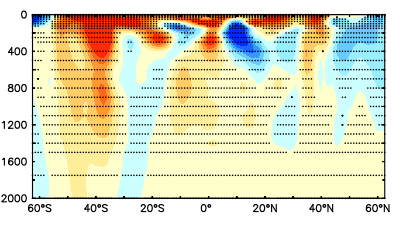
I need some assistance regarding the stippling of one variable over the other.
this is the data that i am using
currently SET data sets:
1> ./
ohcg_trend_ncl.nc (default)
name title I J K L M N
TREND regression coefficient ... 1:126 1:27 ... ... ...
VAL pro ... 1:126 1:27 ... ... ...
i.e. i am having my data on latitude and depth. i am unable to plot the dot symbol over my fill plot. even though it is not showing any error also.
this is the command that i issued to plot fewer dots
cancel data/all
use
ohcg_trend_ncl.nclet nz = `val,return=ksize`
let ny = `val,return=jsize`
let lat = y[gy=trend,j=1:`ny`:2] + 0*z[gz=trend,k=1:`nz`:2]
let dep = 0*y[gy=trend,j=1:`ny`:2] + z[gz=trend,k=1:`nz`:2]
let pp = if val[j=1:`ny`:1,k=1:`nz`:1] gt .95 then 1
fill/nokey/set/lev=(-inf)(-5,5,1)(inf)/nolab/palette=blue_orange trend
plot/nolab/nokey/vs/ov/sym=dot pp*lat, pp*dep
by issuing these commands i am getting dots but all are in a rows i.e. dots in a line.