Hello ferreters,
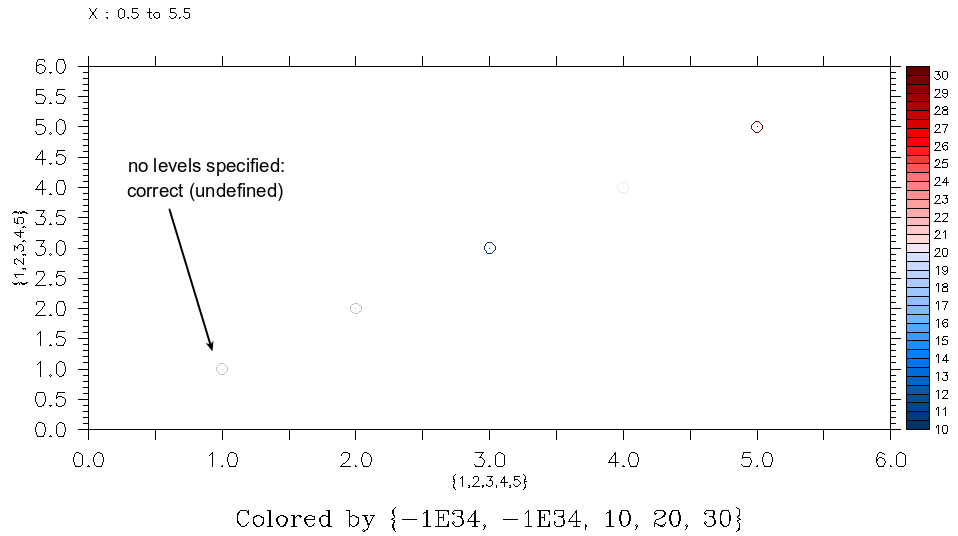
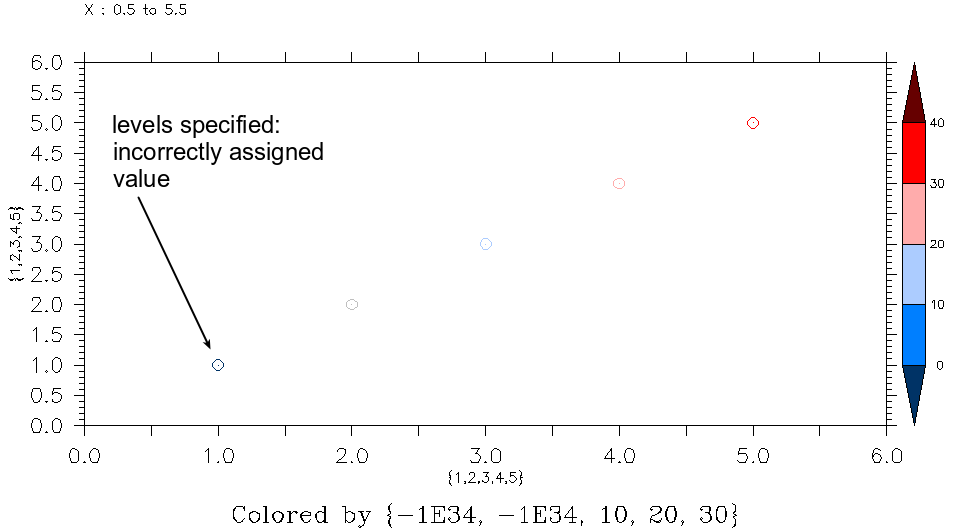
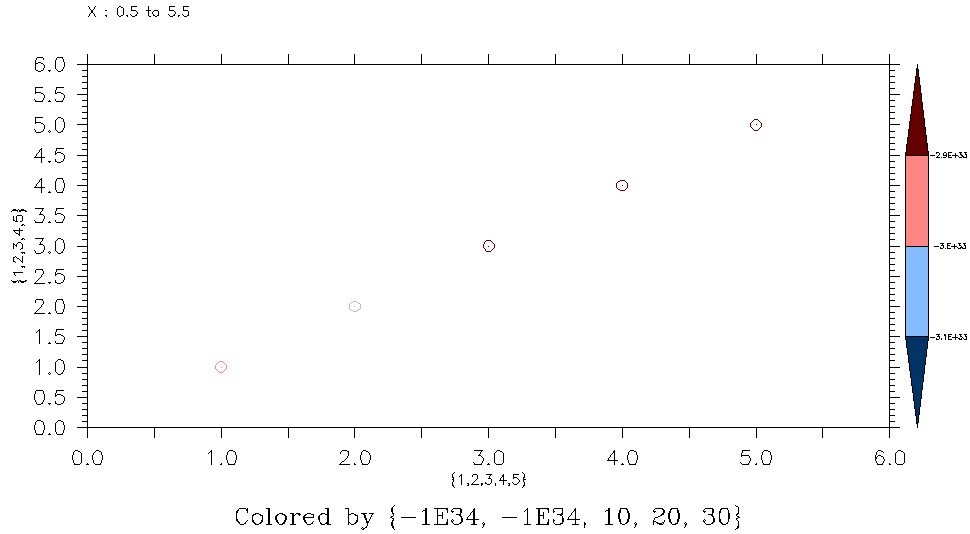
when executing the following commands in ferret, the second missing value in variable 'a' is plotted with the correct level color in all 3 plot commands. The first missing value is only plotted with the correct level color (undefined, for example gray) when no levels /lev=... are specified. If levels are specified, the first point is given a spurious value of somewhere between -0.3E34 and -0.29E34. Minimal working example:
let a = {-1E34, -1E34, 10, 20, 30}
let b = {1,2,3,4,5}
plot/rib/vs/sym=27/size=0.18/vlim=0:6/hlim=0:6 b,b,a
plot/rib/vs/sym=27/size=0.18/vlim=0:6/hlim=0:6/lev=(-inf)(0,40,10)(inf) b,b,a
plot/rib/vs/sym=27/size=0.18/vlim=0:6/hlim=0:6/lev=(-inf)(-0.33E34,-0.28E34,0.1E33)(inf) b,b,a
Figures produced with the three plot commands are attached.
I hoped to use plot/ribbon command for my data as the polymark command cannot deal with undefined values either, at least not if they appear as a block at the beginning of the data used to color levels. In polymark, this shifts the time axis by several hours to incorrect times (more complicated case, don't have a minimal working example for this one at the moment).
Thanks in advance for directions.
Best wishes,
Hella
Attachment:
plot_rib_nolev.png
Description: PNG image
Attachment:
plot_rib_lev.png
Description: PNG image
Attachment:
plot_rib_levdetail.png
Description: PNG image