Hello,
I have an ascii file that has 4columns in this order:
column 1: day number from 127 to 273(every 10min)
column 2: temperature of depth 1m
column 3: temperature of depth 5m
column 4: temperature of depth 9m
and has 21032 rows...
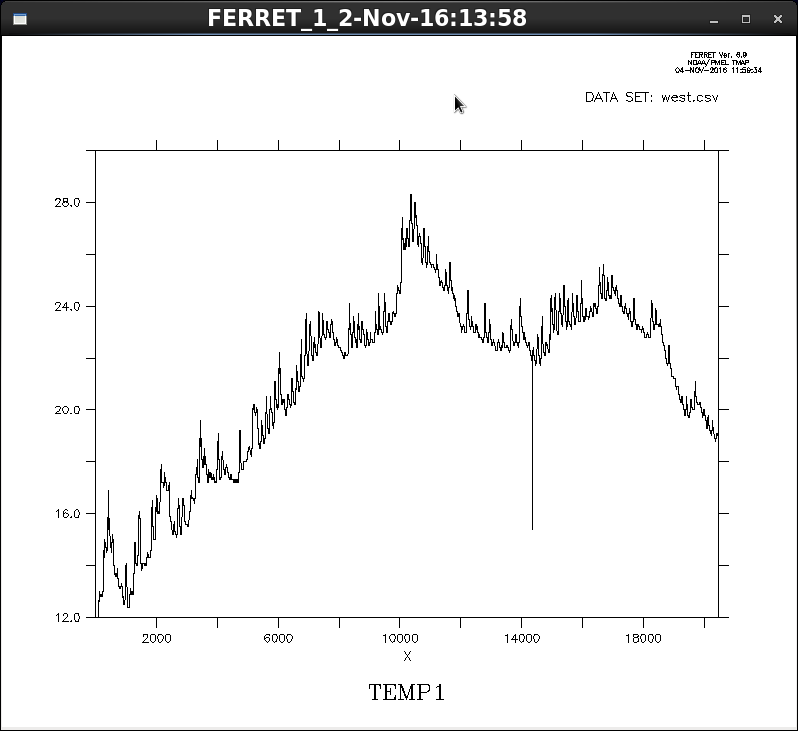
if I want to plot temp 1, I type this:
file/format=delim/skip=1/var="time,temp1,temp5,temp9" west.csv
plot temp1
and it produces a plot of temp vs row numbers (attached file)...how can I define my time axis so that my plot is the temperature vs time(day).
I tried to use
define axis/t=127:273/npoint=21032/ units=days day_axis
yes? let temp_on_time=temp1[gt=day_axis@asn]
plot temp_on_time
but seems I can't use this script here (probably because my file is ascii?).
this is my first question. and I'll ask my second one after I fix this part.
Thank you,
Sara