[
Thread Prev
][
Thread Next
][
Index
]
[ferret_users] change of time-series curves colors
To
:
ferret <
ferret_users@xxxxxxxx
>
Subject
:
[ferret_users] change of time-series curves colors
From
:
Nanda Kishore Reddy <
nandu.eng@xxxxxxxxx
>
Date: Wed, 26 Oct 2016 23:46:19 +0530
Dkim-signature: v=1; a=rsa-sha256; c=relaxed/relaxed; d=noaa-gov.20150623.gappssmtp.com; s=20150623; h=mime-version:from:date:message-id:subject:to:x-original-sender :x-original-authentication-results:precedence:mailing-list:list-id :list-post:list-help:list-archive:list-unsubscribe; bh=NO67sZNAjhZzqVly0HwuRh2Lw8LMLhXGyz7TkYVDIsw=; b=GI7Zvtm/of60eQYljj/iADD+dB4/mrUaeU8YLHUfDJpd25eloADaZ4DxrBMAx9L8/s 9dgP8KgimfKgQPTKfCwSSQDxrha+ahb0IvpKC3PBt00caQ21dKIRJVGcgUwRp2iIinQ5 cIGcrIlS/lKvLvFoIcgcVO+aP3Sd1ZKggXy6GFgwDaphr4dJr04P13wKmkdUNiqlw4I9 JRXWs0yQciH9wT8CvH1cn9sY6J7cdA6wwRj3hTbCHWPLwGOaEE0D4zIuj6KWnpIjegmz eraYKt/iEobFagOUVVproOOywTfu/2vytOLcjF2JlhPdNUNOnqK2/zVhPwnpcMmDrFjg JPbw==
List-archive: <
https://groups.google.com/a/noaa.gov/group/ferret_users/
>
List-help: <
https://support.google.com/a/noaa.gov/bin/topic.py?topic=25838
>, <
mailto:ferret_users+help@noaa.gov
>
List-id: <ferret_users.noaa.gov>
List-post: <
https://groups.google.com/a/noaa.gov/group/ferret_users/post
>, <
mailto:ferret_users@noaa.gov
>
List-unsubscribe: <
mailto:googlegroups-manage+809428289204+unsubscribe@googlegroups.com
>, <
https://groups.google.com/a/noaa.gov/group/ferret_users/subscribe
>
Mailing-list: list
ferret_users@xxxxxxxx
; contact
ferret_users+owners@xxxxxxxx
Sender:
owner-ferret_users@xxxxxxxx
Hi Ferret users,
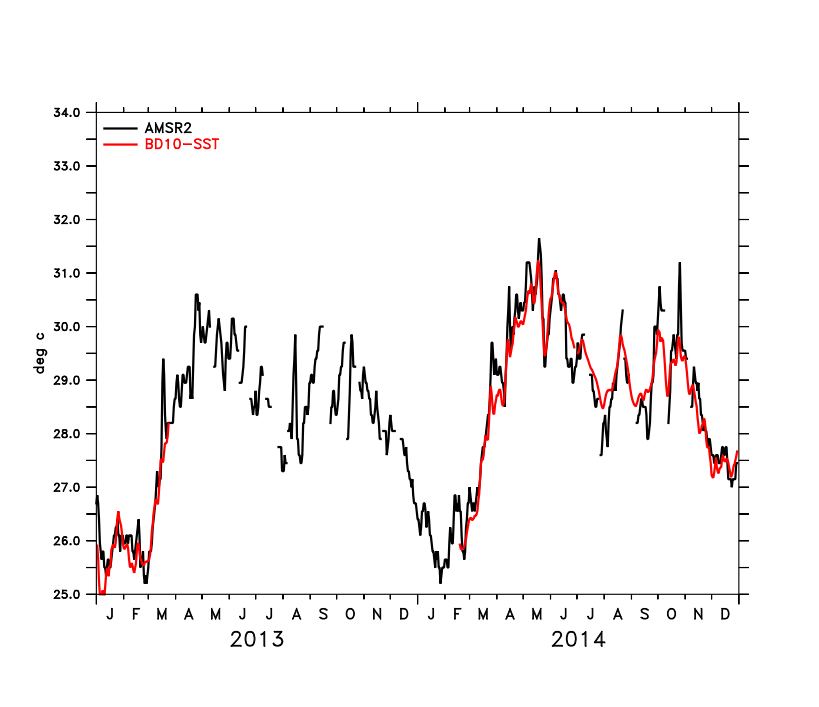
I have plotted the time-series lines of two data sets by using plot/set command, but here I would like to replace the black curve by grey curve and the red curve by black curve. How can I change these color curves.
can data/all; can var/all; set me/size=300
use
amsr2_2013_14.nc
use
bd10_sst_davg.nc
plot/set_up/nolab/thick/vlim=25:34:0.5/t=01-jan-2013:31-dec-2014 sst[d=1,x=80,y=10,d=1], bd10_sst[d=2,l=@sbx:3]
go legend 1 "AMSR2"
go legend 2 "BD10-SST"
ppl ylab "deg c"
ppl dfltfnt dr
ppl txlsze 0.13
ppl plot
With Kind Regards
B. Nanda Kishore Reddy,
Attachment:
bd10_vs_amsr2_timeseries.png
Description:
PNG image
Follow-Ups
:
Re: [ferret_users] change of time-series curves colors
From:
Ansley C. Manke
Previous by thread:
[ferret_users] Re: conservation of surface values according to @DIN operator
Next by thread:
Re: [ferret_users] change of time-series curves colors
[
Thread Prev
][
Thread Next
][
Index
]
Contact Us
Dept of Commerce
/
NOAA
/
OAR
/
PMEL
/
Ferret
Privacy Policy
|
Disclaimer
|
Accessibility Statement