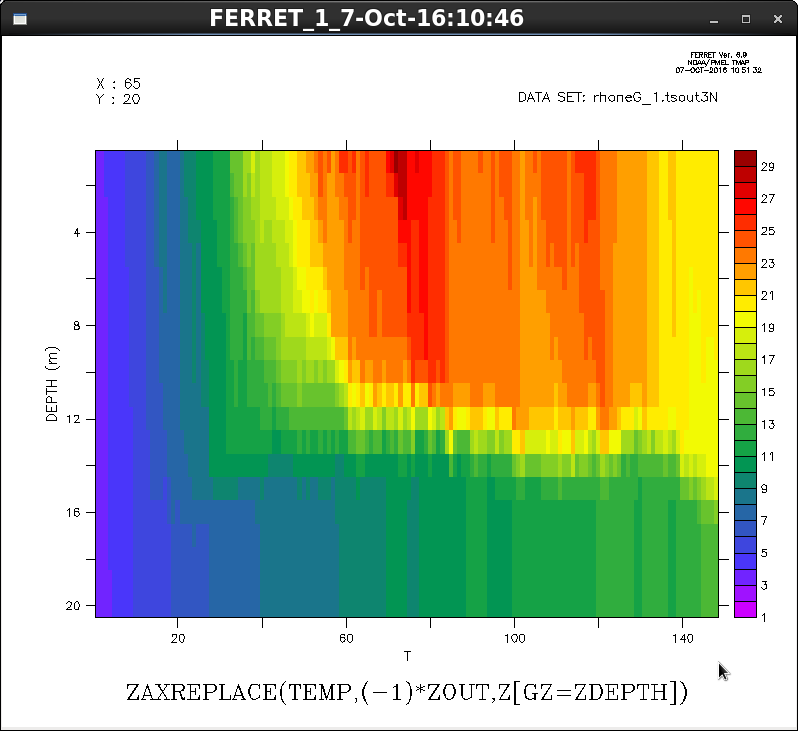
Thank you Ansley, but the script that you gave me produced no plot And I got a white and empty plot.Here are my show data info:
currently SET data sets:
1> ./rhoneG_1.tsout3N (default)
name title I J K L M N
XOUT longitude 1:193 1:87 ... ... ... ...
YOUT latitude 1:193 1:87 ... ... ... ...
ZOUT Z-coordinate 1:193 1:87 1:25 ... ... ...
DEPOUT Mean_water_depth 1:193 1:87 ... ... ... ...
TIME Time ... ... ... 1:59 ... ...
UVEL X-component_of_current 1:193 1:87 1:25 1:59 ... ...
VVEL Y-component_of_current 1:193 1:87 1:25 1:59 ... ...
TEMP Temperature 1:193 1:87 1:25 1:59 ... ...
I entered:
yes? define axis/z=0:65:5/units=m depthaxis
yes? let/units="Degree C" temp_z = temp[gz(sigma) = depthaxis]

as my max depth is 64m.


I also tried this:

define axis/z/from/units=m/depth my_z_axis=zout
 **ERROR: improper grid or axis definition: data for DEFINE AXIS/FROM_VARIABLE is ambiguous
but don't know what this error means and how I can fix it?
Regards
Sara
On Monday, October 3, 2016 6:28 PM, Ansley C. Manke <ansley.b.manke@xxxxxxxx> wrote:
HiFerret gets that information from the dataset. For many model outputs, there is a separate variable in the dataset that defines the depth as a function of layer. There are older functions in Ferret that will do this operation, but the best way is the "Auxiliary Variable Regridding" operation, available in Ferret v6.96 and higher. See:
The examples in the Ferret manual define a sigma function using variables in the file. I am guessing that you may be using a file that already contains a variable that defines the conversion between layers and depth. It may be named something else of course. Look for the "coordinates" attribute in the dataset.
If your variable is "temp", then part of the ncdump output of the file might look like this:
The variable "temp", and the coordinate variables "sigma" and "model_level" all have the same z dimension "zlev". The native grid of temp is on the model-level axis, just level # 1, 2, 3... To get a variable on a depth axis, the data in "sigma" can be used to convert between the two.float temp(zlev,lat,lon); temp:units="Degree C"; temp:coordinates="model_level"; float sigma(zlev); sigma:long_name="sigma"; sigma:positive="down"; sigma:units="m"; int model_level(zlev); model_level:long_name="model level number"; model_level:positive="down";
So, you would define any depth axis, with the same units as "sigma". Define your depth axis to have depths with the range of depth values that appear in the sigma coordinate variable in your dataset.
Now you can make a plot of the variable "temp_z" and it will be on a depth axis.yes? define axis/z=0:5000:10/units=m depthaxis yes? let/units="Degree C" temp_z = temp[gz(sigma) = depthaxis]
-Ansley
On 10/3/2016 10:08 AM, 'sarasari206@xxxxxxxxx' via _OAR PMEL Ferret Users wrote:
Hello Ferret Users,I want to plot a transect of temp with region of x=193 by y=87 points which has 25 layes in depth. But I dont want to have layers in my yaxis when plotting. I want to have depth instead of number of layers. Could you please tell me What the script is for that?Thanks
Attachment:
sample.png
Description: PNG image