Hi Saurabh,
Also note that you can use the contributed script def_monthaxis_days.jnl in your $FER_DER/contrib directory. It allows you to quickly make a time axis with points centred in the middle of the month. You can regrid your original time series using the @ASN regridding. This is probably a bit more
consistent with what you are trying to do.
Try
go/help def_monthaxis_days
for more details.
Cheers,
Russ
On 21/07/16 03:14, Ansley C. Manke wrote:
Hi,
Ferret does regridding and other analysis operations using the idea of grid cells. A regridding operation takes all data from the source axis that lie within the January grid cell of the destination axis. This includes data from all points whose grid cells overlap the January grid cell.
The January 1901 cell from your source axis has the coordinate vale at 1-Jan-1901, and so its grid cell starts in mid-December 1900, and ends in mid-January 1901. The February 1901 cell from the source axis starts in mid-January 1901 and ends at mid-February 1901. You can see more details about the axes using a SHOW AXIS command:
The result of the @MOD regridding operation uses a weighted average, so the January result will be computed from portions of the source grid data cells that lie in the month of January.yes? show axis/L=1:15 `sst,return=taxis`
yes? show axis/L=1:12 MONTH_GREGORIAN
-Ansley
On 7/20/2016 2:40 AM, saurabh rathore wrote:
Thanks Russ, my apologies for getting back late.
But i suddenly i got something very weired in ferret while making climatology and regriding it to original variable time axis. while regriding the climatology to the original variable time axis lets say test_cli=temp_cli[gt=sst], then the values are not exactly the same values of climatology. i dont know what to do about this.
is it a bug that ferret is having so something i am doing wrong. please help me out.
i am attaching my jnl file and here i am giving the description for my data.
name title I J K L M N
SST sea surface temperature (degc) 1:360 1:180 ... 1:1368 ... ...
GRID GPP1
name axis # pts start end
LON LONGITUDE 360mr 179.5W(-179.5) 179.5E
LAT LATITUDE 180 r 89.5S 89.5N
normal Z
TIME TIME 1368 i 01-JAN-1901 00:00 01-DEC-2014 00:00
normal E
normal F
list/x=85/y=16/l=1:24 test_cli
VARIABLE : TEMP_CLI[GT=SST]
FILENAME : sstnew.nc
SUBSET : 24 points (TIME)
LONGITUDE: 84.5E
LATITUDE : 15.5N
84.5E
265
01-JAN-1901 00 / 1: 26.37
01-FEB-1901 00 / 2: 26.74
01-MAR-1901 00 / 3: 27.74
01-APR-1901 00 / 4: 28.98
01-MAY-1901 00 / 5: 29.62
01-JUN-1901 00 / 6: 29.40
01-JUL-1901 00 / 7: 28.82
01-AUG-1901 00 / 8: 28.53
01-SEP-1901 00 / 9: 28.64
01-OCT-1901 00 / 10: 28.60
01-NOV-1901 00 / 11: 27.89
01-DEC-1901 00 / 12: 26.91
01-JAN-1902 00 / 13: 26.37
01-FEB-1902 00 / 14: 26.73
01-MAR-1902 00 / 15: 27.73
01-APR-1902 00 / 16: 28.98
01-MAY-1902 00 / 17: 29.62
01-JUN-1902 00 / 18: 29.41
01-JUL-1902 00 / 19: 28.82
01-AUG-1902 00 / 20: 28.53
01-SEP-1902 00 / 21: 28.64
01-OCT-1902 00 / 22: 28.60
01-NOV-1902 00 / 23: 27.90
01-DEC-1902 00 / 24: 26.91
list/x=85/y=16/l=1:24 temp_cli
VARIABLE : SST[GT=MONTH_GREGORIAN@MOD]
FILENAME : sstnew.nc
SUBSET : 24 points (TIME)
LONGITUDE: 84.5E
LATITUDE : 15.5N
84.5E
265
16-JAN 12 / 1: 26.32
15-FEB 02 / 2: 27.11
15-MAR 17 / 3: 28.45
15-APR 05 / 4: 29.52
15-MAY 17 / 5: 29.73
15-JUN 05 / 6: 29.08
15-JUL 17 / 7: 28.54
15-AUG 17 / 8: 28.52
15-SEP 05 / 9: 28.77
15-OCT 17 / 10: 28.42
15-NOV 05 / 11: 27.37
15-DEC 17 / 12: 26.42
test_cli is the regridded variable and temp_cli is the climatology.
i hope this is some permanent solution to get rid of this problem. as far i can understand as my data is starting from 01-jan-1901 so the day is 01 but my climatology stat from 16-jan so the day is 16 so while regriding the ferret is doing something that i am not able to understand.
i hope i will get the solution as soon as possible. thanks in advance.
regards
On Mon, Jul 4, 2016 at 6:24 AM, Russ Fiedler <russell.fiedler@xxxxxxxx> wrote:
Hi,
You can mask according to time as follows:
! Expand climatology out to full axis.
let sst_clim=temp_cli_nino[gt=sst]
! Mask according to time
let sst_comb = if t ge `t[t=01-sep-1997,gt=sst]` and t le `t[t=31-dec-1997,gt=sst]` then sst_clim else sst
plot/x=180/y=0 sst,sst_clim,sst_comb
Cheers,
Russ
On 01/07/16 14:38, saurabh rathore wrote:
Dear Ansley,
my purpose of masking is to mask SST values of SEPT, OCT, NOV, DEC of year 1997 only. i don't want to mask any other months of other years except these 4 months of 1997 and after masking i want to place climatological values of SEPT, OCT, NOV, DEC for the above months of 1997.
i tried but unable to do so.
regards, saurabh
On Fri, Jul 1, 2016 at 12:05 AM, Ansley C. Manke <ansley.b.manke@xxxxxxxx> wrote:
Hi Saurabh
This can be done with the "masking" capability.
http://ferret.pmel.noaa.gov/Ferret/documentation/users-guide/variables-xpressions/XPRESSIONS#_VPID_181Take the example in the FAQ on climatologies.
Simplifying some of the syntax in that example - define a climatology. Then go on to define a variable which replaces some values of the file variable with that climatology.
http://ferret.pmel.noaa.gov/Ferret/faq/how-do-i-calculate-climatologies-and-climatological-anomalies
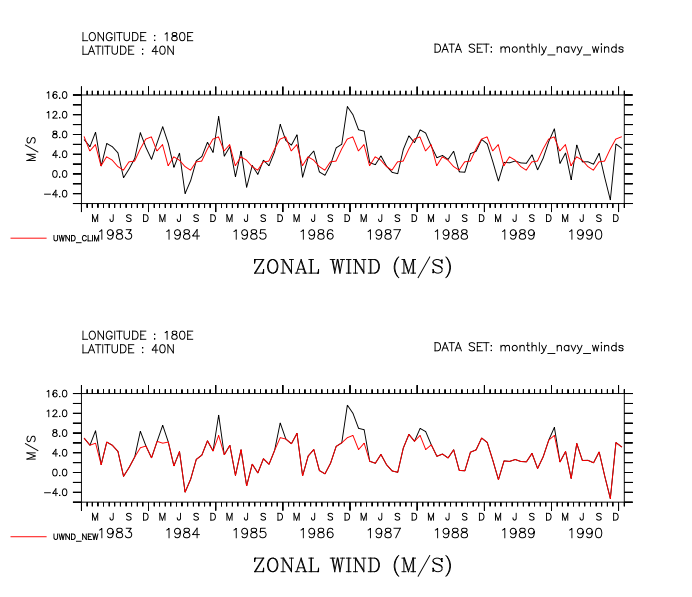
! open a dataset and define the climatology(you'll see some NOTEs about ambiguous coordinates when the 'replace' variable is computed. This is fine.)
yes? SET DATA monthly_navy_winds
yes? LET uwnd_climatology = uwnd[GT=month_reg@MOD]
! Plot the data and the climatology together.
! Using /VLIM will make it easier to compare this plot with the next one.
yes? set view upper
yes? PLOT/X=180/Y=40/T=15-jan-1983:15-jan-1991/vlim=-6:16 uwnd
yes? PLOT/OVER/X=180/Y=40/T=15-jan-1983:15-jan-1991 uwnd_climatology
! Now define the new variable with some values of unwd replaced by the climatology.
! Plot the original variable, then overlay the new one.
yes? let uwnd_replace = if uwnd gt 8 then uwnd_climatology else uwnd
yes? set view lower
yes? PLOT/X=180/Y=40/T=15-jan-1983:15-jan-1991/vlim=-6:16 uwnd
yes? PLOT/OVER/X=180/Y=40/T=15-jan-1983:15-jan-1991 uwnd_replace
So the only thing left is for you to find a way to define a "mask" variable which is on the time axis of SST, and has the value of say, 1 at the times when you want to keep the SST time series data, and 0 when you want to make the replacement.
yes? let replace_var = if mask eq 1 then SST[d=1] else TEMP_CLI[d=2]
-Ansley
On 6/30/2016 7:31 AM, saurabh rathore wrote:
Dear Ferreters,
i am facing a problem in replacing some particular time steps data with the Climatological data of the same months.
for example i am having SST data from 1901-2014 in which i want to replace September, October, November and December of 1997 and January, February of 1998 from the climatological values of the same months i.e. Sep-1997 by Sept-Climatological value, Oct-1997 by Oct-Climatological value and so on.
this is my data description
SST data 1901-2014
name title I J K L M N
SST sea surface temperature (degc) 1:360 1:180 ... 1:1368 ... ...
Climatology
name title I J K L M N
TEMP_CLI NINO1[GT=MONTH_GREGORIAN@MOD] 1:360 1:180 ... 1:12 ... ...
i hope i made my problem clear and i believe i will get the solution.
regards, saurabh
--
REGARDS
Saurabh RathoreResearch Scholar (PhD.)Centre For Oceans, Rivers, Atmosphere & Land Science TechnologyIndian Institute Of Technology, Kharagpurcontact :- 91- 8345984434
--
REGARDS
Saurabh RathoreResearch Scholar (PhD.)Centre For Oceans, Rivers, Atmosphere & Land Science TechnologyIndian Institute Of Technology, Kharagpurcontact :- 91- 8345984434
--
REGARDS
Saurabh RathoreResearch Scholar (PhD.)Centre For Oceans, Rivers, Atmosphere & Land Science TechnologyIndian Institute Of Technology, Kharagpurcontact :- 91- 8345984434