On Mon, Jul 4, 2016 at 6:24 AM, Russ Fiedler <russell.fiedler@xxxxxxxx> wrote:
Hi,
You can mask according to time as follows:
! Expand climatology out to full axis.
let sst_clim=temp_cli_nino[gt=sst]
! Mask according to time
let sst_comb = if t ge `t[t=01-sep-1997,gt=sst]` and t le `t[t=31-dec-1997,gt=sst]` then sst_clim else sst
plot/x=180/y=0 sst,sst_clim,sst_comb
Cheers,
Russ
On 01/07/16 14:38, saurabh rathore wrote:
Dear Ansley,
my purpose of masking is to mask SST values of SEPT, OCT, NOV, DEC of year 1997 only. i don't want to mask any other months of other years except these 4 months of 1997 and after masking i want to place climatological values of SEPT, OCT, NOV, DEC for the above months of 1997.
i tried but unable to do so.
regards, saurabh
On Fri, Jul 1, 2016 at 12:05 AM, Ansley C. Manke <ansley.b.manke@xxxxxxxx> wrote:
Hi Saurabh
This can be done with the "masking" capability.
http://ferret.pmel.noaa.gov/Ferret/documentation/users-guide/variables-xpressions/XPRESSIONS#_VPID_181Take the example in the FAQ on climatologies.
Simplifying some of the syntax in that example - define a climatology. Then go on to define a variable which replaces some values of the file variable with that climatology.
http://ferret.pmel.noaa.gov/Ferret/faq/how-do-i-calculate-climatologies-and-climatological-anomalies
! open a dataset and define the climatology(you'll see some NOTEs about ambiguous coordinates when the 'replace' variable is computed. This is fine.)
yes? SET DATA monthly_navy_winds
yes? LET uwnd_climatology = uwnd[GT=month_reg@MOD]
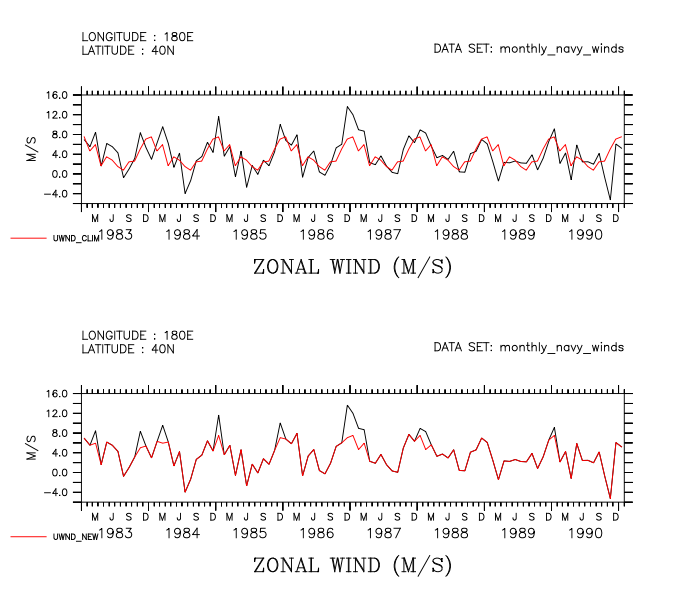
! Plot the data and the climatology together.
! Using /VLIM will make it easier to compare this plot with the next one.
yes? set view upper
yes? PLOT/X=180/Y=40/T=15-jan-1983:15-jan-1991/vlim=-6:16 uwnd
yes? PLOT/OVER/X=180/Y=40/T=15-jan-1983:15-jan-1991 uwnd_climatology
! Now define the new variable with some values of unwd replaced by the climatology.
! Plot the original variable, then overlay the new one.
yes? let uwnd_replace = if uwnd gt 8 then uwnd_climatology else uwnd
yes? set view lower
yes? PLOT/X=180/Y=40/T=15-jan-1983:15-jan-1991/vlim=-6:16 uwnd
yes? PLOT/OVER/X=180/Y=40/T=15-jan-1983:15-jan-1991 uwnd_replace
So the only thing left is for you to find a way to define a "mask" variable which is on the time axis of SST, and has the value of say, 1 at the times when you want to keep the SST time series data, and 0 when you want to make the replacement.
yes? let replace_var = if mask eq 1 then SST[d=1] else TEMP_CLI[d=2]
-Ansley
On 6/30/2016 7:31 AM, saurabh rathore wrote:
Dear Ferreters,
i am facing a problem in replacing some particular time steps data with the Climatological data of the same months.
for example i am having SST data from 1901-2014 in which i want to replace September, October, November and December of 1997 and January, February of 1998 from the climatological values of the same months i.e. Sep-1997 by Sept-Climatological value, Oct-1997 by Oct-Climatological value and so on.
this is my data description
SST data 1901-2014
name title I J K L M N
SST sea surface temperature (degc) 1:360 1:180 ... 1:1368 ... ...
Climatology
name title I J K L M N
TEMP_CLI NINO1[GT=MONTH_GREGORIAN@MOD] 1:360 1:180 ... 1:12 ... ...
i hope i made my problem clear and i believe i will get the solution.
regards, saurabh
--
REGARDS
Saurabh RathoreResearch Scholar (PhD.)Centre For Oceans, Rivers, Atmosphere & Land Science TechnologyIndian Institute Of Technology, Kharagpurcontact :- 91- 8345984434
--
REGARDS
Saurabh RathoreResearch Scholar (PhD.)Centre For Oceans, Rivers, Atmosphere & Land Science TechnologyIndian Institute Of Technology, Kharagpurcontact :- 91- 8345984434
--
Saurabh Rathore
Research Scholar (PhD.)
Centre For Oceans, Rivers, Atmosphere & Land Science Technology
Indian Institute Of Technology, Kharagpur
contact :- 91- 8345984434