I am a new ferret user and try to plot the model output among the cruise line (to create a vertical section plot). But there seems to be a few complications.
Could anyone help me to find out where did I do wrong? (Q1~Q)
my code:
let x_varC=samplexy(o_dfe[d=1,l=3],order_x,order_y)
define axis/y/name=yax_sect/from_data/units=degrees_north order_Y
let y_profile=reshape(x_varC,Y[gy=yax_sec]]+Z[gz=o_dfe[d=1]])
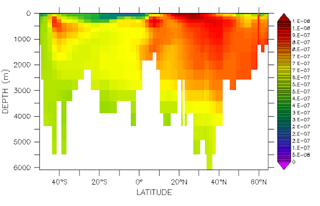
sha y_profile
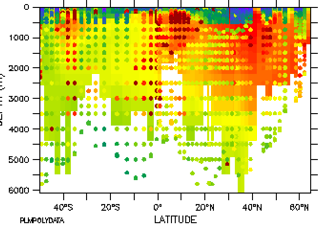
and there is the plot i got(below left), I was happy, but….oh…wait…. after I plot the cruise data overlaying my plot, i found out that the samplexy function did not sample to the whole depth of the model output(below right).
so i check the model depth setting and found out that when i use the following code, ferret does reach to the deepest point, but samplexy doesn’t:
yes? List o_dfe[d=1,l=3,x=`order_x[i=1]`,y=`order_y[i=1]`],x_varC[i=1]
!-> List o_dfe[d=1,l=3,x=307.3118896484375,y=-49.54719924926758],x_varC[i=1]
DATA SET: ./tavg.01201.01.31.nc
DEPTH (m): 0 to 6080
LATITUDE: 49.5S
TIME: 17-MAR-1201 00:00 NOLEAP
Column 1: O_DFE[X=52.2W(307.8)] is O_dfe (mol Fe m-3)
Column 2: X_VARC[X=1] is SAMPLEXY(O_DFE[D=tavg.01201.01.31,L=3:7@AVE],ORDER_X,ORDER_Y)
O_DFE X_VARC
17.5 / 1: 1.514E-07 1.779E-07
82.5 / 2: 3.811E-07 3.939E-07
177.5 / 3: 4.923E-07 4.972E-07
302.5 / 4: 5.087E-07 5.103E-07
457.5 / 5: 5.271E-07 5.234E-07
642.5 / 6: 5.393E-07 5.349E-07
857.5 / 7: 5.427E-07 5.416E-07
1102.5 / 8: 5.432E-07 5.438E-07
1377.5 / 9: 5.436E-07 ....
1682.5 / 10: 5.499E-07 ....
2017.5 / 11: 5.570E-07 ....
2382.5 / 12: 5.625E-07 ....
2777.5 / 13: .... ....
3202.5 / 14: .... ....
3657.5 / 15: .... ....
4142.5 / 16: .... ....
4657.5 / 17: .... ....
5202.5 / 18: .... ....
5777.5 / 19: .... ….
Q1:I suspect it is due to the spatial interpolation? who knows why?
to work around it, I use simplex_closest instead, but there is an error message that i don’t understand:
yes? stat x_varC
Bailing out of external function "samplexy_closest":
cannot handle MODULO axis that is not regular
**ERROR: error in external function
yes? stat o_dfe[d=1,l=3]
O_dfe
LONGITUDE: 0E(0) to 0E(360)
LATITUDE: 90S to 90N
DEPTH (m): 0 to 6080
TIME: 17-MAR-1201 00:00 NOLEAP
E: N/A
F: N/A
DATA SET: ./tavg.01201.01.31.nc
Total # of data points: 190000 (100*100*19*1*1*1)
# flagged as bad data: 102693
Minimum value: 4.482837E-09
Maximum value: 0.000015577
Mean value: 5.929552E-07 (unweighted average)
Standard deviation: 2.776047E-07
I tried to redefine the x axis of the data, by applying the exact axis that my data has:
define axis/x=1.8:360:3.6 xreg
let o_dfe_gx=o_dfe[d=1,l=3,gx=xreg]
let x_varC=samplexy_closest(o_dfe_gx,order_x,order_y)
Q2: it works better, however, some of the deepest box are still missing. When i redefine the Y axis, a whole section of the data won’t show up in the x_varC.why?
It seems to me that only the “list” could find the real closest grid and accesses the deepest box,so I ask ferret to write all the point into one file and try to use it as a new variable.
list/nohead/norowlab/file=odef.dat/append o_dfe[d=1,l=3,x=`order_x[i=1]`,y=`order_y[i=1]`]
…
list/nohead/norowlab/file=odef.dat/append o_dfe[d=1,l=3,x=`order_x[i=57]`,y=`order_y[i=57]`]
Q3: is there a better way to do this, instead of 57 lines of code? I tried to use “rep”:
rep/x=1:57 list/nohead/norowlab/file=odfe.dat/append o_dfe[d=1,l=3,x=`order_x[i=`x`@din]`,y=`order_y[i=`x`@din]`]
but it doesn’t work. what did i do wrong?
Q4: i am also open to criticism about how to do this in a better way :)
thanks in advance:)
Ben
P.S.:
My working environment: Ferret ver 6.94, Macbook pro,
Model : UVic earth system climate model 2.9
My cruise line coordinations:
yes? list order_x[i=1:57],order_y[i=1:57]
X: 0.5 to 5.5
ORDER_X ORDER_Y
1 / 1: 307.3 -49.55
2 / 2: 311.3 -48.89
3 / 3: 312.8 -46.92
4 / 4: 314.5 -44.71
5 / 5: 316.0 -42.37
...
Model : UVic earth system climate model 2.9
My cruise line coordinations:
yes? list order_x[i=1:57],order_y[i=1:57]
X: 0.5 to 5.5
ORDER_X ORDER_Y
1 / 1: 307.3 -49.55
2 / 2: 311.3 -48.89
3 / 3: 312.8 -46.92
4 / 4: 314.5 -44.71
5 / 5: 316.0 -42.37
...