I want to use the "fill" command to
make a Hovmoller plot over the course of the year for a climatological
variable. By default, ferret doesn't interpolate over the end-of-year
break, leaving white space for the first half of January and the last
half of December when using monthly data. This doesn't look great for a published figure. Is there a good way to ensure that data is plotted there?
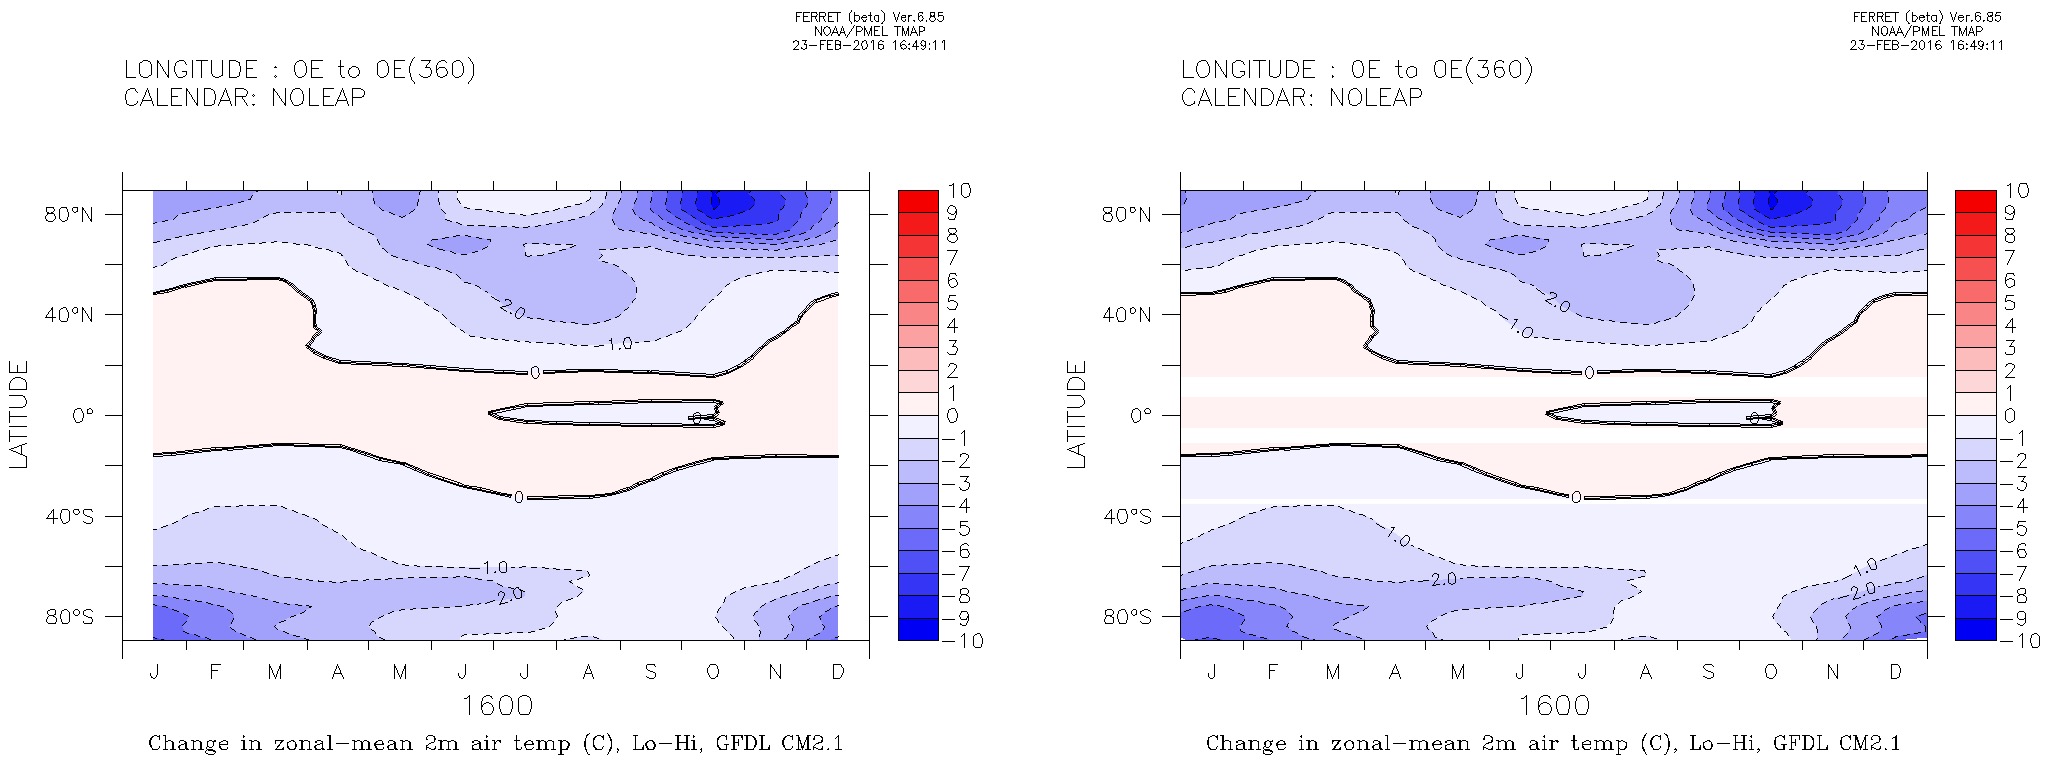
One thing that I tried was to define the timespan and the hlimit to get ferret to plot that time of
the year as well (e.g. fill/lin/key/t=1-dec-1599:1-feb-1601/hl=1-jan-1600:1-jan-1601 t_ref[d=1,x=@ave]). This fixes my first problem, but introduces a new one: all latitudes
where the color of the plot doesn't change over the course of the year
are plotted white. I assume the
problem is because the left and right "edges" of the data are outside of
the plot, but I'm not sure how to fix it. I've attached a figure to show what I mean. The plot on the left is default ferret behavior. The plot on the right is my attempt to fix it, but with the horizontal white bands.
Is there a better way to do what I'm trying to do?