Hi,
The FILL commands you show have the qualifier /NOKEY, so that is why
there are no colorbars. That's a good way to make a set of plots if
they all use the same color levels, as in the "multi_view_demo"
script that is described in the post that you found, but for several
different variables you do want the colorbars. Removing the /NOKEY
will make the default vertical colorbar to the right of each plot.
Also try it with /KEY=HORIZONTAL, which will put the color bar on
the top; see if you like that.
I'll show an example with one of the sample datasets, calling
multi_view, and take the opportunity to show some commands and
features that people may not have worked with. Here are the
references:
http://ferret.pmel.noaa.gov/Ferret/documentation/users-guide/commands-reference/annotate
http://ferret.pmel.noaa.gov/Ferret/documentation/users-guide/commands-reference/SET#_SETTEXT
(for PyFerret)
http://ferret.pmel.noaa.gov/Ferret/faq/modifying-the-shade-key
To clean up the plots, the examples use /NOLABEL to remove the
automatic labels that Ferret would ordinarily draw. Of course it's
important to add back enough labels to document what's on the plot.
Because all of the plots show the same region, another way to
de-clutter the plot is to label the plot axes with longitude and
latitude only along the left-hand side and lower edge of the set of
plots, using the PPL AXLABP command. This way the interior of the
page isn't cluttered up with labels.
! If running PyFerret, you can set a font. Skip this
if running classic Ferret.
set text/font=arial
cancel mode logo
! Define 4 viewports, (use "GO/HELP multi_view" to see the
documentation for multi_view.jnl)
go multi_view 2,2,0.35,0.1,0.1,0.35,0.1,0.1
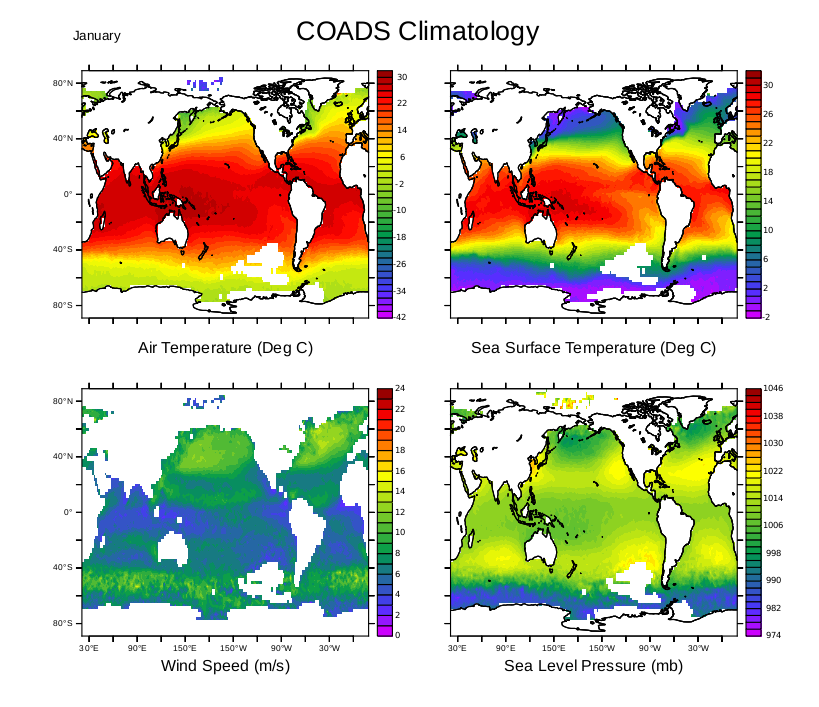
use coads_climatology
! In the upper left plot, make axis labels only on the latitude
axis.
set view v11
ppl axlabp,0,-1
! make the plot, removing labels.
fill/l=1/nolab airt; go land
! Use the ANNOTATE command to add a title below the plot
annotate/norm/xpos=0.5/ypos=-0.14/halign=0 "Air Temperature (Deg
C)"
! In the upper left plot, make no axis labels
set view v12
ppl axlabp,0,0
! make the plot, removing default labels.
fill/l=1/nolab sst; go land
annotate/norm/xpos=0.5/ypos=-0.14/halign=0 "Sea Surface
Temperature (Deg C)"
! In the lower left plot, label both coordinate axes
set v v21
ppl axlabp, -1,-1
fill/l=1/nolabz wspd
annotate/norm/xpos=0.5/ypos=-0.14/halign=0 "Wind Speed (m/s)"
! In the lower right plot, label only the longitude axis.
set v v22
ppl axlabp, -1,0
fill/l=1/nolab slp; go land
annotate/norm/xpos=0.5/ypos=-0.14/halign=0 "Sea Level Pressure (mb)"
! Now, there should be some labels for the overall plot. To position
these
! relative to the whole page, use the viewport "full" which is
always defined.
! Draw a blank plot, by drawing a point but setting the /HLIMITS
so the point
! is off the page. Use /NOLABELS and /NOAXES, and nothing is
drawn.
set view full
plot/noaxis/nolabel/vs/hlim=1:2 {0,0}, {0,0}
! Now make some labels for the dataset and the date. Other
relevant information
! can be added in the same way, anywhere on the plot.
annotate/norm/xpos=0.5/ypos=1.15/halign=0 "COADS Climatology"
annotate/norm/xpos=0/ypos=1.15/halign=0/siz=0.1 "January"
frame/file=viewports_example.png ! Use .gif for Ferret
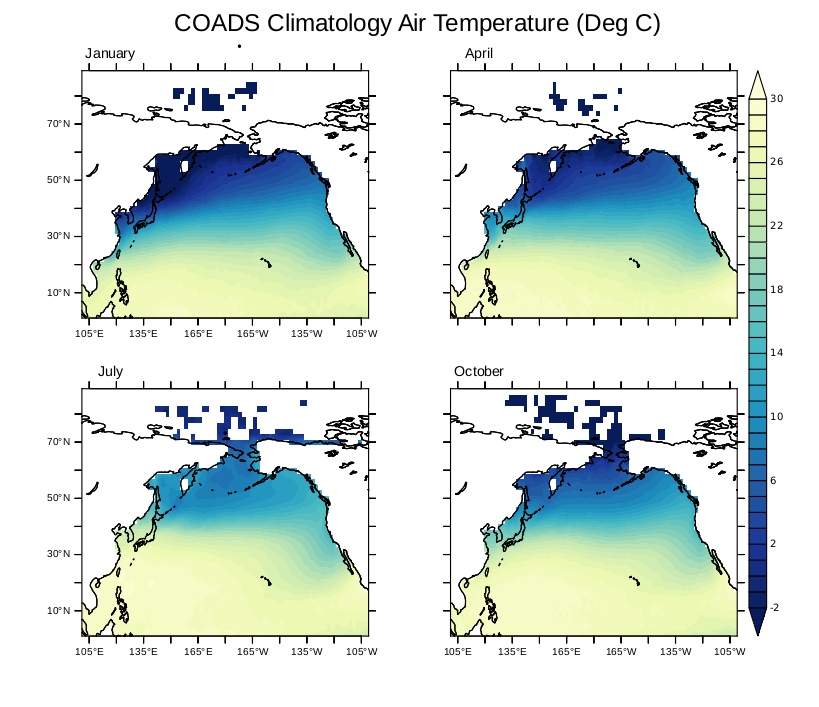
Another case: if the plots all show the same variable or comparable
variables, for instance at different time steps, it's a good idea to
use the same color scale throughout by specifying /LEVELS=. Then,
draw a single colorbar on the page. Here's a message about that:
http://www.pmel.noaa.gov/maillists/tmap/ferret_users/fu_2000/msg00226.html
Here's an example, using the viewports and settings for axis labels
as above. For this one, the arguments to multi_view could be changed
so that there would be less white space between the viewports.
set text/font=arial
cancel mode logo
! Define 4 viewports
go multi_view 2,2,0.35,0.1,0.1,0.35,0.1,0.1
use coads_climatology
! Set a sub-region, and a new color palette
! Define fixed color levels for all the plots
set region/x=100e:100w/y=0:90
palette blue_green_yellow
define symbol airt_levels = /lev=(-inf)(-2,30,1)(inf)
set view v11
ppl axlabp,0,-1
! make the plot, removing labels.
fill/l=1/nolab/nokey($airt_levels) airt; go land
annotate/norm/xpos=0.1/ypos=1.05/halign=0/size=0.14 "January"
set view v12
ppl axlabp,0,0
! make the plot, removing default labels.
fill/l=4/nolab/nokey($airt_levels) airt; go land
annotate/norm/xpos=0.1/ypos=1.05/halign=0/size=0.14 "April"
set v v21
ppl axlabp, -1,-1
fill/l=7/nolab/nokey($airt_levels) airt; go land
annotate/norm/xpos=0.1/ypos=1.05/halign=0/size=0.14 "July"
! On the last plot, draw a color key.
! Do not use /NOKEY, and use /SET, so the custom color key
can be
! defined with PPL SHAKEY. The key can extend anywhere on the
plot page,
! page, even beyond the current viewport but the locations are
given
! relative to the plot origin in the current viewport.
set v v22
ppl axlabp, -1,0
fill/l=10/nolab($airt_levels)/set airt
ppl shakey 1,1,,,,,`($ppl$xorg)+($ppl$xlen)+0.2`,
`($ppl$xorg)+($ppl$xlen)+0.5`, ($ppl$yorg),
`2*(($ppl$yorg)+($ppl$ylen))`
ppl fill
go land
annotate/norm/xpos=0.1/ypos=1.05/halign=0/size=0.14 "October"
! Now make an overall annotation with the variable name and
dataset name.
set view full
! draw a blank plot
plot/noaxis/nolabel/vs/hlim=1:2 {0,0}, {0,0}
annotate/norm/xpos=0.5/ypos=1.17/siz=0.18/halign=0 "COADS
Climatology Air Temperature (Deg C)"
frame/file=viewports_example2.png
On 2/20/2016 8:20 AM, afwande juliet
wrote:
Dear users
I am making some plots; i want to reduce white spaces
between the plots and make one color bar for the plots
I am using this attached script and my plots look like this
which are not very attractive
thanks
|