Dear ferreters,
I need your help in interpolating and drawing two datasets. The first data set is on coarse grid x=1:1280:1/y=1:720:1 and the second on fine one x=1:5120:1/y=1:2880:1. Each 4th grid point in the fine grid is the same as in coarse resolution grid in space so
coarse res. grid point fine res. grid point
(1,1) (4,4)
(1,2) (4,8)
(2,2) (8,8)
.....
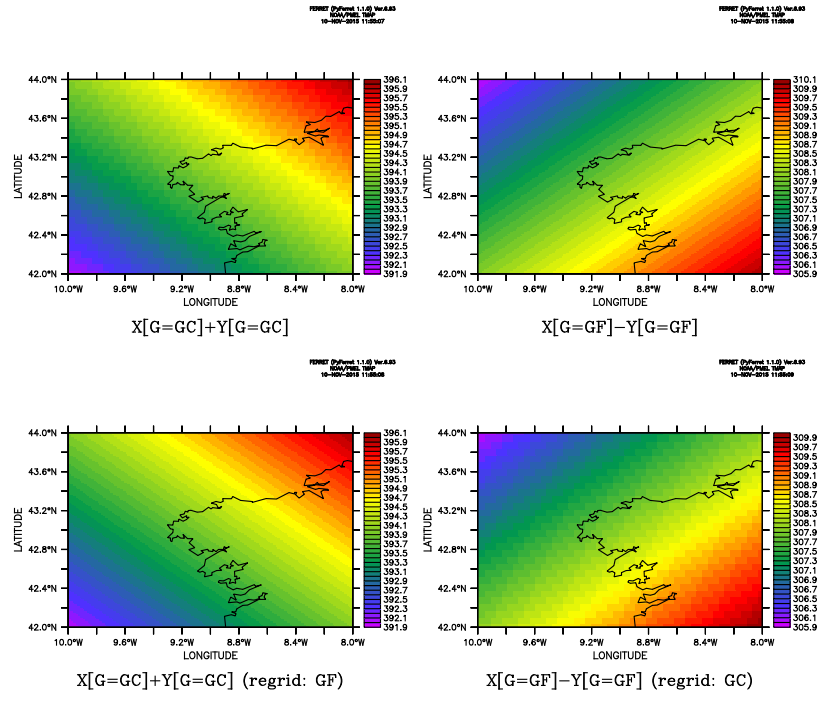
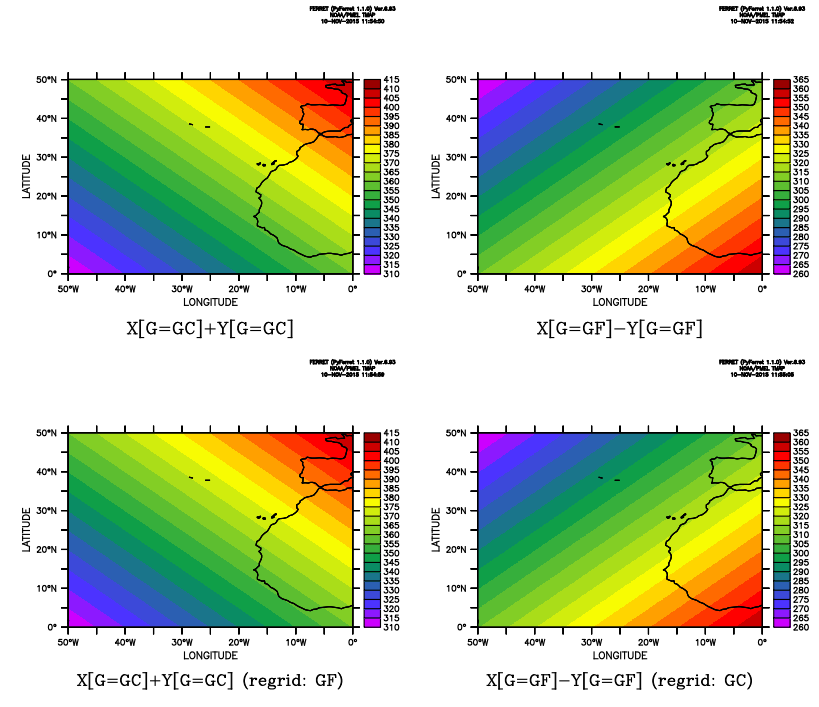
I need to draw variable which is defined on coarse grid, on fine grid. Obviously there will be "empty" grid points on fine grid so it should be interpolate,
Thanks in advance,
Robert Osinski
NPS,
Monterey, CA
Attachment:
int2d_demo_zoom.png
Description: PNG image
Attachment:
int2d_demo.png
Description: PNG image
 ! NOAA/PMEL TMAP
 ! FERRET v6.93 (PyFerret 1.1.0)
 ! Linux 2.6.35.14-106.fc14.i686 - 12/05/14
 ! 10-Nov-15 11:39

def ax/y=0:50/np=2880/unit=LATITUDE yf
def ax/y=0:50/np=720/unit=LATITUDE  yc

def ax/x=310:360/np=1280/unit=LONGITUDE xc
def ax/x=310:360/np=5120/unit=LONGITUDE xf

def gr/x=xc/y=yc gc
def gr/x=xf/y=yf gf

let xyc = x[g=gc]+y[g=gc]
let xyf = x[g=gf]-y[g=gf]

set mem/size=100

set viewp ul; shade xyc; go land
set viewp ur; shade xyf; go land
set viewp ll; shade xyc[g=gf]; go land
set viewp lr; shade xyf[g=gc]; go land

frame/file=int2d_demo.png

canc viewp
set reg/x=350:352/y=42:44
set viewp ul; shade xyc; go land_detail
set viewp ur; shade xyf; go land_detail
set viewp ll; shade xyc[g=gf]; go land_detail
set viewp lr; shade xyf[g=gc]; go land_detail

frame/file=int2d_demo_zoom.png

quit

quit