Hii folks,
I have converted a grd.ctl file to nc and trying to plot a variable out of it. The variable has been averaged over time so it has a single time step. I am using following arguments to plot the variable-
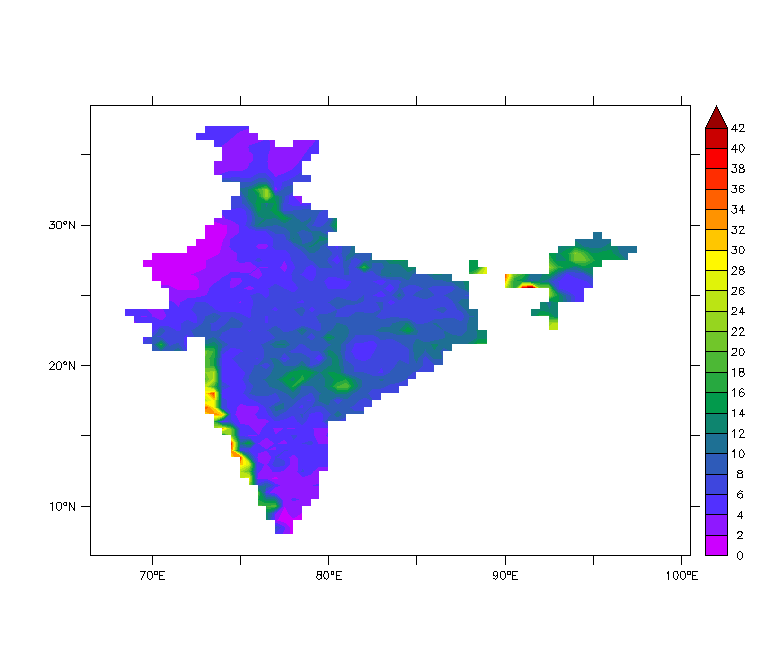
yes? use rf_1988_JJAS_timmean.nc
yes? fill/lev=(0,42,2)(inf)/nolabel rf
yes? label 71,-30,0,0,0.18 "JJAS Precipitation (mm/day)"
But the label command is not displaying the text at the desired location in the plot. While the same label command has worked for me on other files. Can anybody help me figure out the error. Attaching the output for reference.
Thanks in anticipation.
Dhirendra
--
========================================
Dhirendra Kumar
UGC-JRF
School of Environmental Sciences, JNU
New Delhi (India)
Contact: +91 9910778043
=========================================