If what you want is dashed lines, you could try fiddling with adding arguments to the /DASH qualifier, making shorter "down" segments:
http://ferret.pmel.noaa.gov/Ferret/documentation/users-guide/commands-reference/PLOT#_VPINDEXENTRY_1475
Another alternative for showing the grids is to just make symbols, either at the grid cells or the corners, so
yes? shade h,lon_hyc2,lat_hyc2or with a small symbol of some other shape.yes? plot/nolab/vs/ov/sym=dot lon_hyc2,lat_hyc2
That first plot you showed is pretty nice looking. Interestingly I can't seem to replicate what you did for a rectangular grid where I define 2-dimensional longitudes and latitudes for a simple 1-D grid, trying to simulate the 2-D coordinates:
yes? use coads_climatologyI only see the horizontal dashed lines. Did you show your whole script?
yes? let/title="longitude"/units=degrees_east lon = x[gx=sst] + 0*y[gy=sst]
yes? let/title="latitude"/units=degrees_north lat = 0*x[gx=sst] + y[gy=sst]
yes? shade/l=1/hlim=180:240/vlim=0:40 sst, lon, lat
yes? let lon2 = (lon+lon[i=@shf:1])/2
yes? let lat2 = (lat+lat[j=@shf:1])/2
yes? plot/dash/vs/ov lon2,lat2
On 9/9/2015 2:54 PM, Andre Paim wrote:
Dear all,
I've been trying to plot the grid from my model on top of a shade plot and I just cant seem to make it right. I have two grids, one regular and another irregular and curved along the coast.
Here is how I'm plotting that for the regular grid.
let lon_hyc2 = (lon_hyc+lon_hyc[i=@shf:1])/2let lat_hyc2 = (lat_hyc+lat_hyc[j=@shf:1])/2
shade h,lon_hyc2,lat_hyc2plot/dash/vs/ov lon_hyc2,lat_hyc2
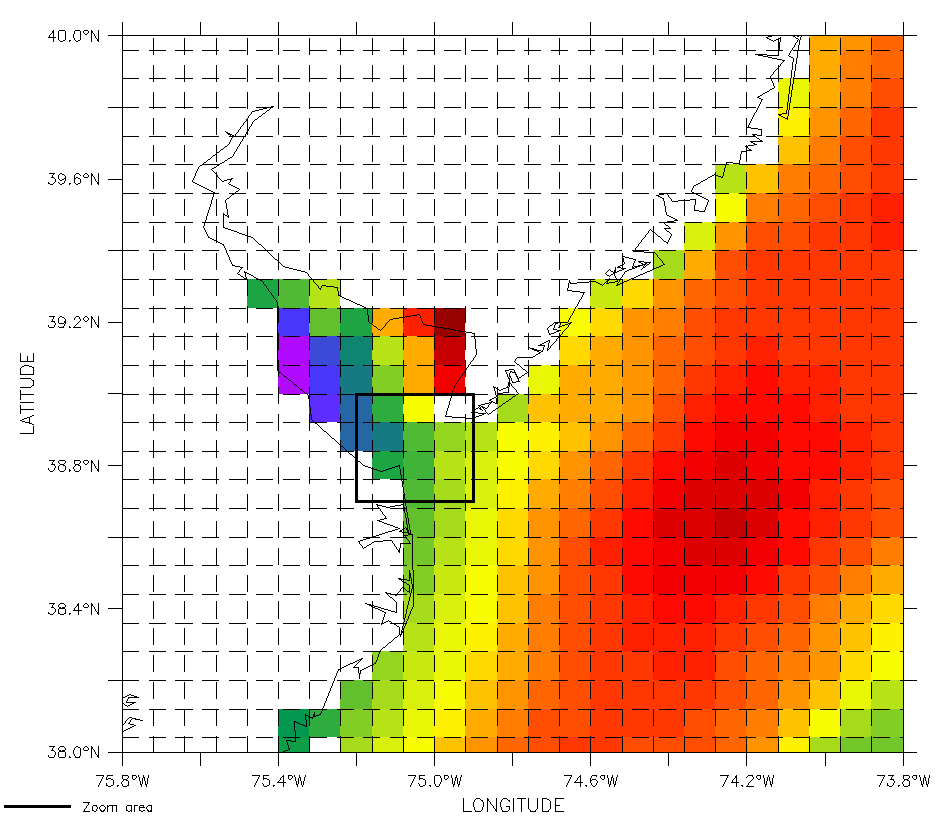
I don't know if that is a coincidence, but the plot works fine for the area I'm plotting as can be seem bellow.
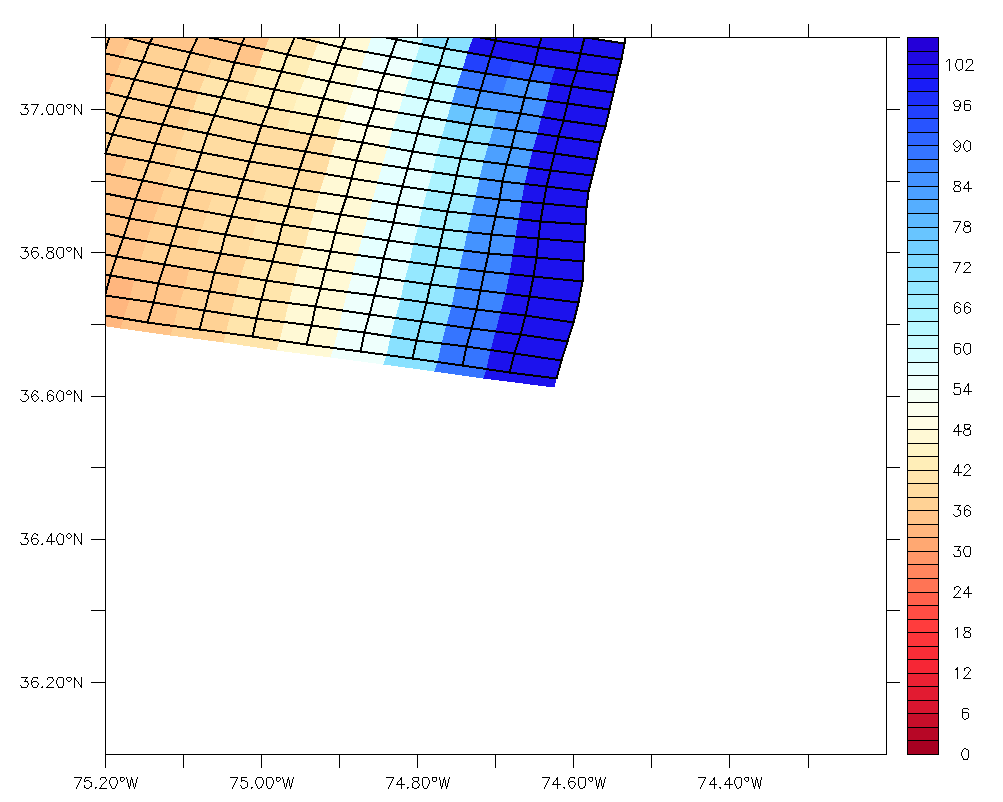
However, when I try to do the same to the irregular grid, this is what I get.
Both models are not projected, with lon and lat in their respective variables.Is there an easier way to do that?
Thanks in advance,Andre Rodrigues