help
Hello,
Would you please give me a command to plot uvel vs depth ( depth be in the y-axis), this is what I have in sh d:
yes? use pycnoB_2.tsout3N
yes? sh d
currently SET data sets:
1> ./pycnoB_2.tsout3N (default)
name title I J K L M N
XOUT X-coordinate 1:1 1:1 ... ... ... ...
YOUT Y-coordinate 1:1 1:1 ... ... ... ...
ZOUT Z-coordinate 1:1 1:1 1:100 ... ... ...
DEPOUT Mean_water_depth 1:1 1:1 ... ... ... ...
TIME
Time ... ... ... 1:1 ... ...
UVEL X-component_of_current 1:1 1:1 1:100 1:1 ... ...
DRHO
Density_difference 1:1 1:1 1:100 1:1 ... ...
VDIFCOEFSCAL
Eddy_diffusivity 1:1 1:1 1:100 1:1 ... ...
TKE Turbulent_kinetic_energy 1:1 1:1 1:100 1:1 ... ...
ZLMIX Mixing_length 1:1 1:1 1:100 1:1 ... ...
DISSIP Dissipation_of_turbulence_kinet 1:1
1:1 1:100 1:1 ... ...
RICH Richardson_number 1:1 1:1 1:100 1:1 ... ...
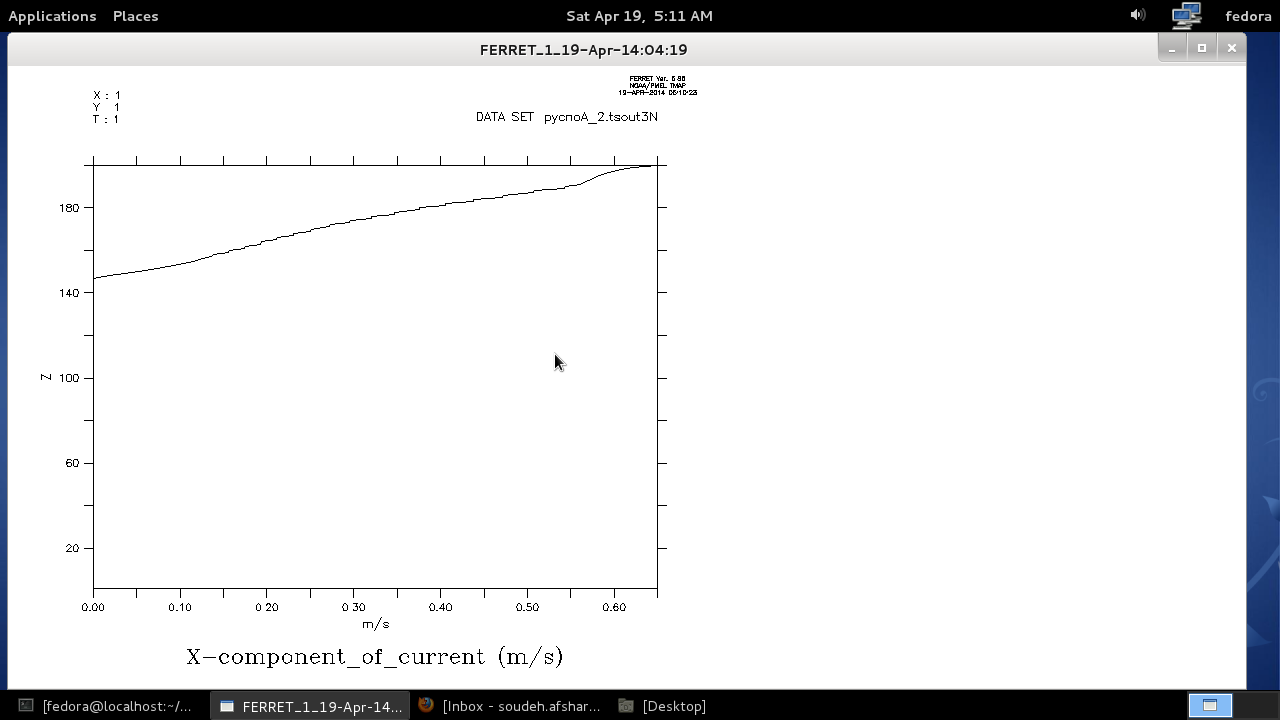
this is a column of water with a depth of 100m, what I have in ZOUT is 100 layers of water, I don't want Z to be in my plot but when I type plot uvel instead of having depth in m in y-axis I have Z without any unit( as it is only layers of water), a graph like the first file that I attached.
What I want, is to have the second file( it was a sample in a manual of the program I run).
Thank you,
Sara