|
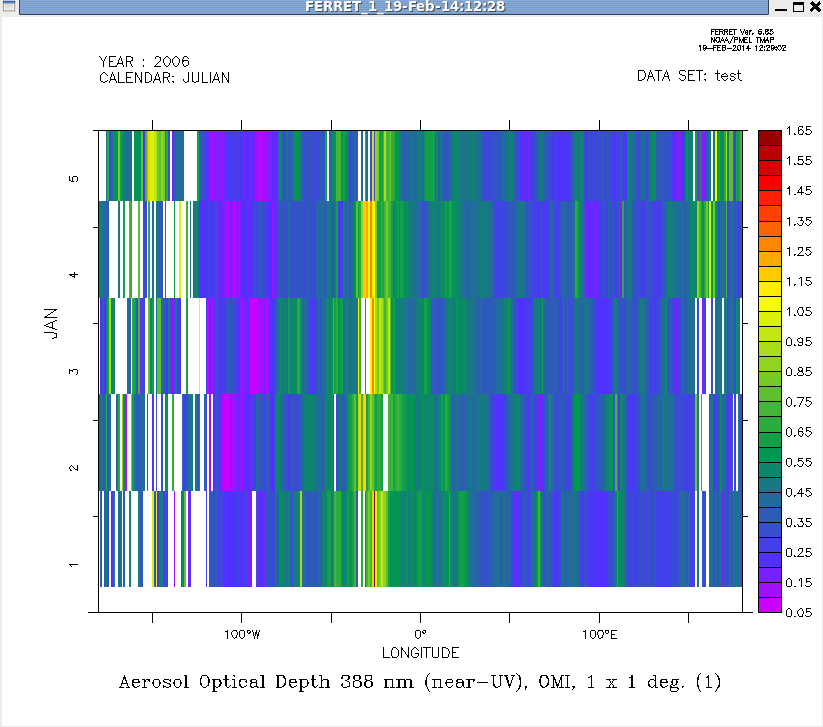
I am trying to use Ferret to do a Hovmoller plot with a simple
netCDF file. Wonder why the Hovmoller plot came out slightly shifted upward (by ~6 hours; attached). The header of the CDL is below. I can send the netcdf file also if needed but thought the problem could be just some mistake using Ferret. Thanks. -Fan > ferret/bin/ferret NOAA/PMEL TMAP FERRET v6.85 Linux 2.6.32-358.23.2.el6.x86_64 64-bit - 11/12/13 19-Feb-14 12:28 yes? use test.nc yes? show data currently SET data sets: 1> ./test.nc (default) name title I J K L M N OMAERUVD_003_FINALAEROSOLEXTOPTICALDEPTH388 Aerosol Optical Depth 388 nm (n 1:360 ... ... 1:5 ... ... yes? shade OMAERUVD_003_FINALAEROSOLEXTOPTICALDEPTH388 The values of the time and 'time_bnds' variables are: time = 1136073600, 1136160000, 1136246400, 1136332800, 1136419200 ; time_bnds = 1136073600, 1136160000, 1136160000, 1136246400, 1136246400, 1136332800, 1136332800, 1136419200, 1136419200, 1136505600 ; netcdf test { dimensions: bnds = 2 ; time = UNLIMITED ; // (5 currently) lon = 360 ; variables: int time_bnds(time, bnds) ; float OMAERUVd_003_FinalAerosolExtOpticalDepth388(time, lon) ; OMAERUVd_003_FinalAerosolExtOpticalDepth388:_FillValue = -1.267651e+30f ; OMAERUVd_003_FinalAerosolExtOpticalDepth388:units = "1" ; OMAERUVd_003_FinalAerosolExtOpticalDepth388:title = "Final Aerosol Extinction Optical Depth at 388 nm" ; OMAERUVd_003_FinalAerosolExtOpticalDepth388:UniqueFieldDefinition = "OMI-Specific" ; OMAERUVd_003_FinalAerosolExtOpticalDepth388:missing_value = -1.267651e+30f ; OMAERUVd_003_FinalAerosolExtOpticalDepth388:origname = "FinalAerosolExtOpticalDepth388" ; OMAERUVd_003_FinalAerosolExtOpticalDepth388:fullnamepath = "/HDFEOS/GRIDS/Aerosol NearUV Grid/Data Fields/FinalAerosolExtOpticalDepth388" ; OMAERUVd_003_FinalAerosolExtOpticalDepth388:orig_dimname_list = "XDim " ; OMAERUVd_003_FinalAerosolExtOpticalDepth388:standard_name = "finalaerosolextopticaldepth388" ; OMAERUVd_003_FinalAerosolExtOpticalDepth388:quantity_type = "Total Aerosol Optical Depth" ; OMAERUVd_003_FinalAerosolExtOpticalDepth388:product_short_name = "OMAERUVd" ; OMAERUVd_003_FinalAerosolExtOpticalDepth388:product_version = "003" ; OMAERUVd_003_FinalAerosolExtOpticalDepth388:long_name = "Aerosol Optical Depth 388 nm (near-UV), OMI, 1 x 1 deg." ; float lon(lon) ; lon:standard_name = "longitude" ; lon:units = "degrees_east" ; lon:long_name = "Longitude" ; int time(time) ; time:standard_name = "time" ; time:units = "seconds since 1970-01-01 00:00:00" ; time:bounds = "time_bnds" ; time:calendar = "JULIAN" ; // global attributes: :Conventions = "CF-1.4" ; :start_time = "2006-01-01T00:00:00Z" ; :end_time = "2006-01-05T23:59:59Z" ; :temporal_resolution = "daily" ; :nco_openmp_thread_number = 1 ; :NCO = "4.3.1" ; :plot_hint_title = "Latitude-Averaged Hovmoller ( 90S - 90N )" ; :plot_hint_subtitle = "daily 1 x 1 deg. Aerosol Optical Depth 388 nm (near-UV), OMI, 1 x 1 deg. [OMAERUVd v3]" ; :plot_hint_x_axis_label = "Longitude" ; :plot_hint_y_axis_label = "Time" ; :plot_hint_caption = "Selected latitude range was 90S - 90N. The variable Aerosol Optical Depth 388 nm (near-UV), OMI, 1 x 1 deg. [OMAERUVd v3] has a limited data extent of 90S - 90N. The longitude range in the title reflects the data extent of the subsetted granules that went into making this result." ; } |
Attachment:
ssw_airs3stm_4.png
Description: PNG image