Dear ferret users,
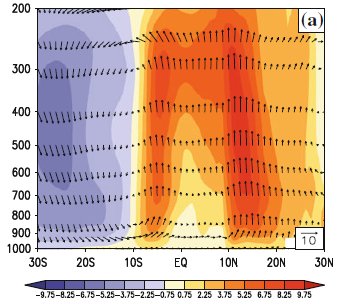
I have U,V and omega (verticle velocity) variables in netcdf format. I have to plot hadley circulation with overlay the shade of magnitude of omega (verticle velocity) in the plot which will indicate the rising and sinking motion of the circulation. Did any one knows how to do it in ferret?
and also my omega is in m/s and I need its magnitude in pa/s any way to convert?
I am attaching the sample type plot which I require and the script so far I tried.
set viewport 1
let u1=u[d=1,k=1:31,x=50:110@ave,y=-15:40,l=185:276@ave]
let v1=v[d=1,k=1:31,x=50:110@ave,y=-15:40,l=185:276@ave]
let omega = w_large[d=2,k=1:31,x=50:110@ave,y=-15:40,l=185:276@ave]
fill/nolab/set omega
ppl title ""
ppl xlab ""
ppl ylab ""
ppl axlsze 0.16,0.16
ppl axlabp -1,-1
PPL LABSET 0.18,0.18,0.18
ppl shakey 1,1,0.15,5
ppl fill
label/nouser `($ppl$xorg)+0.1`,`($ppl$ylen)+0.2`,0, 0, 0.22 "@ASMAM-2002"
vector/over/nolab u1,v1

With Best Wishes,
Nitin Patil