[
Thread Prev
][
Thread Next
][
Index
]
[ferret_users] Inverse Y axis
To
:
ferret_users@xxxxxxxx
Subject
:
[ferret_users] Inverse Y axis
From
:
antonio avio <
antonioavio@xxxxxxxxxxxxxx
>
Date: Tue, 27 Nov 2012 21:08:15 +0900
In-reply-to: <CACKeJXJopKcYXte4Czh15fF+H3912C54ivqhZ58BiuxFP3cvbA@mail.gmail.com>
List-archive: <
http://groups.google.com/a/noaa.gov/group/ferret_users/?hl=en_US
>
List-help: <
http://support.google.com/a/noaa.gov/bin/topic.py?hl=en_US&topic=25838
>, <
mailto:ferret_users+help@noaa.gov
>
List-id: <ferret_users.noaa.gov>
List-post: <
http://groups.google.com/a/noaa.gov/group/ferret_users/post?hl=en_US
>, <
mailto:ferret_users@noaa.gov
>
List-unsubscribe: <
http://groups.google.com/a/noaa.gov/group/ferret_users/subscribe?hl=en_US
>, <
mailto:googlegroups-manage+809428289204+unsubscribe@googlegroups.com
>
Mailing-list: list
ferret_users@xxxxxxxx
; contact
ferret_users+owners@xxxxxxxx
References: <CACKeJXJopKcYXte4Czh15fF+H3912C54ivqhZ58BiuxFP3cvbA@mail.gmail.com>
Sender:
owner-ferret_users@xxxxxxxx
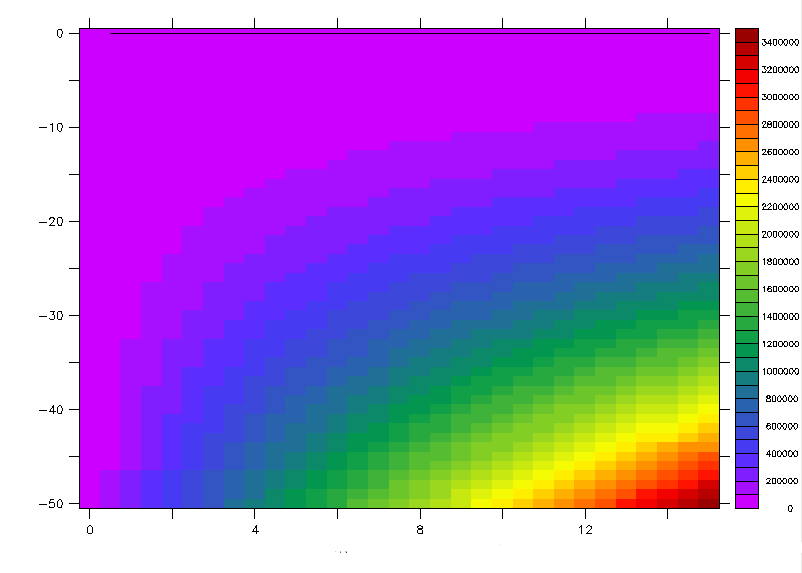
Hallo,
I have a plot (attached)
just wonder how can i inverse the Y axs thus i have maximum y value
-50 upward "not" below the zero.
and how could i show my x-axis with specific interval, let say 5.
Thanks a lot.
Antonio
Attachment:
Screenshot.png
Description:
PNG image
Follow-Ups
:
Re: [ferret_users] Inverse Y axis
From:
Peter Szabo
Previous by thread:
[ferret_users] Spectral analysis
Next by thread:
Re: [ferret_users] Inverse Y axis
[
Thread Prev
][
Thread Next
][
Index
]
Contact Us
Dept of Commerce
/
NOAA
/
OAR
/
PMEL
/
Ferret
Privacy Policy
|
Disclaimer
|
Accessibility Statement