[Thread Prev][Thread Next][Index]
[ferret_users] Re: Creating a grid from lat long variables
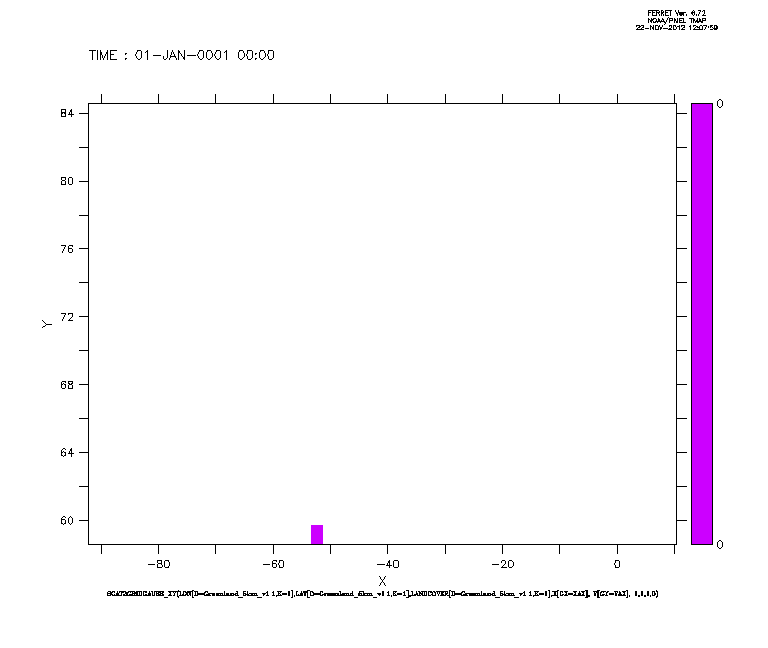
Thanks for your suggestion but I am still having some troubles.
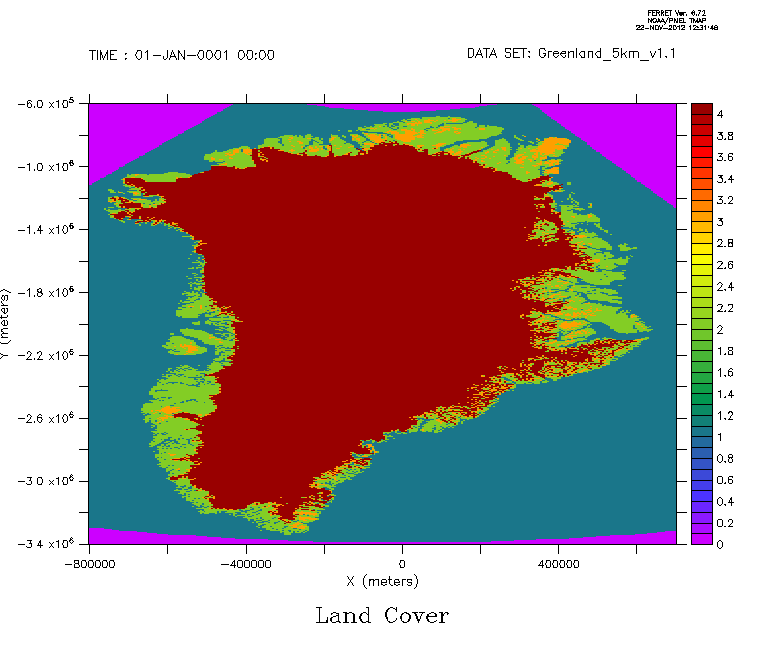
I have attached some images of the result that I get, the original landcover data that I want and the variable lon and lat that the new grid should be created from.
The original grid GPV1 is evenly spaced but the new grid created form xax and yax won't have data everywhere.
I also tried as suggested to specify k=1,
LET LANDCOVERd = scat2gridgauss_xy(lon[k=1],lat[k=1],LANDCOVER[k=1],x[gx=xax], y[gy=yax], 1,1,1,0)
but it gives me the same results.
Any other suggestions?
Kevin
On Wed, Nov 21, 2012 at 6:02 PM, kevin.lemorzadec <kevin.lemorzadec@xxxxxx> wrote:
Dear Users,
I have a set of data containing the latitude, longitude and a mask of the region
LAT Latitude 1:301 1:561 ... 1:1
LON Longitude 1:301 1:561 ... 1:1
LANDCOVER 1:301 1:561 ... 1:1
The grid of these data is in meter :
GRID GPV1
name axis # pts start end
X1 X (meters) 301 r -800000 700000
Y1 Y (meters) 561 r -3400000 -600000
I want to create a new grid in degree using the lat,long data.
I tried to use the scat2gridgauss_xy as below to get the data on a lat long grid (created from the min and max of my lat lon data) but the only result that I can get doing that are 0 in part of the grid.
DEFINE AXIS/X=-92.13:10.399:0.1 xax
DEFINE AXIS/Y=58.629:84.482:0.1 yax
LET LANDCOVERd = scat2gridgauss_xy(lon[d=1],lat[d=1],LANDCOVER[d=1],x[gx=xax], y[gy=yax], 1,1,1,0)
Any suggestion?
--
Kevin
--
Kevin Le Morzadec - Ph.D. candidate
Dept of Physics and Physical Oceanography,
Memorial University of Newfoundland, Canada
Tel 709-864-8654
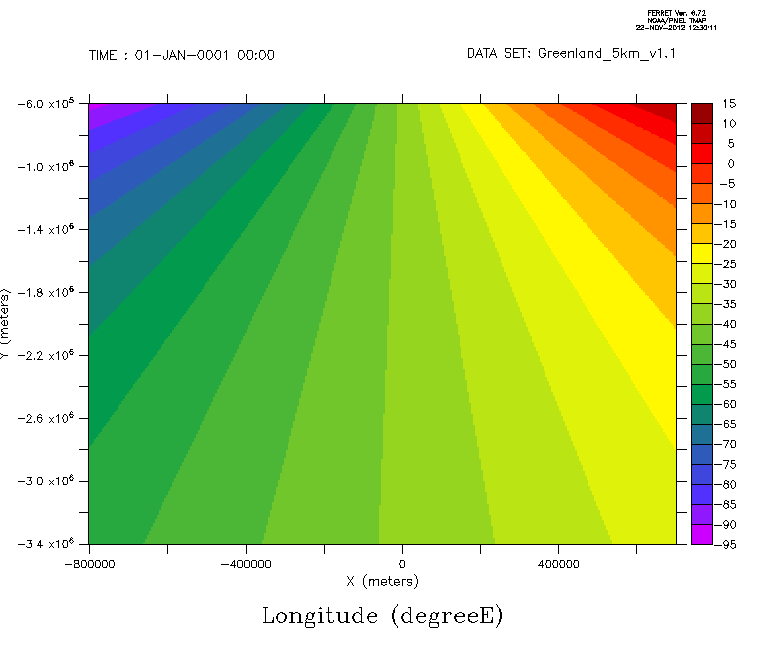
Attachment:
lon.gif
Description: GIF image
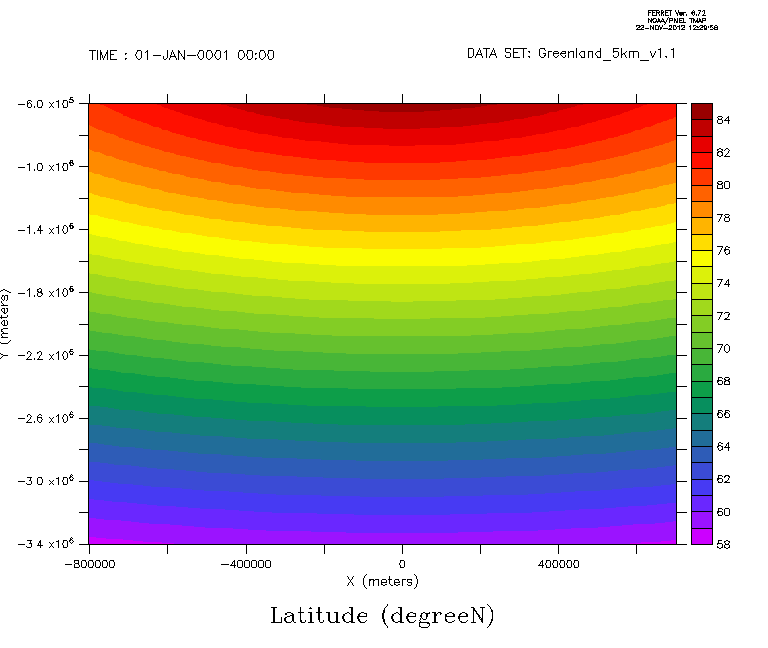
Attachment:
lat.gif
Description: GIF image
Attachment:
scat2grid.gif
Description: GIF image
Attachment:
landcover.gif
Description: GIF image
[Thread Prev][Thread Next][Index]
Contact Us
Dept of Commerce /
NOAA /
OAR /
PMEL /
Ferret
Privacy Policy | Disclaimer | Accessibility Statement