Ferret's graphics lets you view plots of variables on different time axes together using /HLIM or /VLIM. I think this is causing some confusion. To save them to a single dataset, appending them, you would need to put them onto a common time axis, and it is up to the user to make sure that the time origin and axis units match.
Like you I find it a bit surprising that Ferret doesn't issue an error message or warning when you ask to append the variable from the second dataset to the first. The time origin and axis units are not checked when appending variables. What is happening is that it's using NetCDF's capability of altering data in a dataset where if one appends to existing timesteps, those timesteps are overwritten. This allows for correcting data in a dataset. Everything is done in terms of the timesteps, and if the timesteps of the second variable are within the range of those written for the first variable, or because it's the record axis, if they fall after the range of timesteps of the data already written, then it overwrites or appends.
Here's another example. The timesteps of the variable in the second dataset fall within the timesteps of the first datset:
yes? define axis/t=1-jan-2000:31-jan-2000:1/units=days/t0=1-jan-2000 ttaxis
yes? let ti = L[gt=ttaxis]
yes? save/clobber/file=t1.nc ti
yes? define axis/units=hours/t0=1-jan-1999 ttaxis = {21,22,23,24,25}
yes? let ti = L[gt=ttaxis]
yes? save/clobber/file=t2.nc ti
yes? cancel data/all
yes? cancel variable/all
yes? cancel axis ttaxis
yes? use t1; sho grid ti
...
TTAXIS TIME 31 r 01-JAN-2000 00:00 31-JAN-2000 00:00
yes? use t2; sho grid ti
...
TTAXIS1 TIME 5 r 01-JAN-1999 21:00 02-JAN-1999 01:00
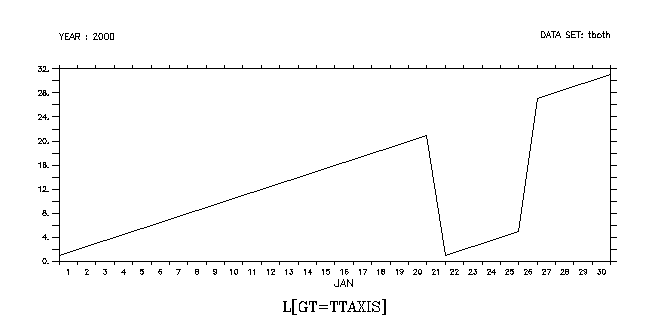
yes? save/clobber/file=tboth.nc ti[d=1],ti[d=2]
yes? use tboth.nc
yes? show grid ti
TTAXIS TIME 31 r 01-JAN-2000 00:00 31-JAN-2000 00:00
yes? plot ti
On 11/10/2011 6:36 AM, Brockmann Patrick wrote:
Hi all,
I have a problem when I work with 2 variables
that has a time axis with a different time reference.
ncdump file_1850_2005.nc
TIME:units = "days since 1850-01-01 00:00:00" ;
TIME:time_origin = "01-JAN-1850 00:00:00" ;
ncdump file_2006_2100.nc
TIME:units = "days since 2006-01-01 00:00:00" ;
TIME:time_origin = "01-JAN-2006 00:00:00" ;
The result is wrong and it seems that the 2 time series have been
overlapped. See attached image.
Note that when you use the cdo operator cat, the result is correct.
(time reference are first phased then variables are appended).
cdo cat file_1850_2005.nc file_2006_2100.nc file_cat.nc
I have also tried with the TCAT function, but then I loose the time
axis.
Is there a pure ferret solution to this append problem ?
Attached the 2 different files to append
and the err672_append_with_different_reference_date.jnl
Patrick