It pays to watch what goes on in the User Group!Billy's question and Russ's solution toggled a brain cell identifying this as problem that I have dealt with several times in various clunky and ad-hoc ways. Never again ... thanks to Russ.
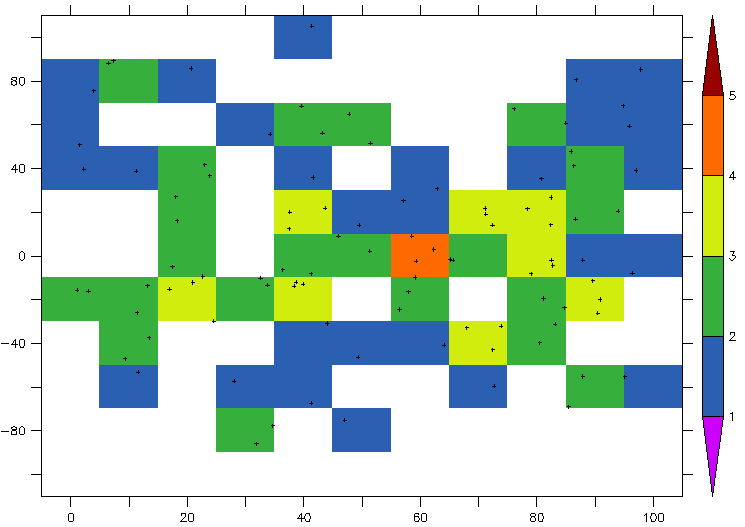
Attached is a script "PointsInCell.jnl", based on his suggestion, but using XBOXLO,... to distribute points across a grid. Specification of the grid is achieved via a variable "outgrid" as used for example in "reshape()". In addition to the variable PointsInCell showing the distribution, a variable OutOfGrid reports how many points of the scatter fall outside the grid. A demo is provided below and an attached graphic illustrates the result.
Hope it helps others, though the SCAT2GRID_NBIN_XY and SCAT2GRID_NBIN_XYT described by Ansley are perhaps more general.
Mick
!-------------------------------------
! DEMO: Using PointsInCell -- here is a set of 100 random coord pairs ... def axis/z=1:100:1 zax ; let vx=100*randu(z[gz=zax]) ; let vy=50*randn(z[gz=zax])
! ... to be distributed in the x-y grid defined by
def axis/x=0:100:10 xax ; def axis/y=-100:100:20 yax

let outgrid=x[gx=xax]+y[gy=yax]
go PointsInCell vx vy outgrid
shade/lev=(-inf)(1,5,1)(inf) PointsInCell ; plot/o/vs/nolab/sym=3 vx,vy
list/nohead/form=(2f6.0) Npoints,OutOfGrid
! the response to the latter 100 2 shows that 2 of the 100 points fall outside the grid.
On Aug 31, 2011, at 11:44 PM, Russell Fiedler wrote:
Billy,
You could try something along the lines of

!put points into 1x1 bins on (0,2]x(0,2]

! here are the points we want to bin

let xvals=zsequence({ 0.1, 2.0, 0.2 })
let yvals=zsequence({ 0.1, 2.0, 0.2 })

! Define our bounds Note promotion to 2D

let xl= i[i=1:2]-1+0*xvals
let xh= i[i=1:2]+0*xvals
let yl= j[j=1:2]-1+0*xvals
let yh= j[j=1:2]+0*xvals

let isinboxx = if ( xvals le xh and xvals gt xl ) then 1 else 0
let isinboxy = if ( yvals le yh and yvals gt yl ) then 1 else 0

let isinbothboxes = isinboxx*isinboxy
let numinbox = isinbothboxes[z=@sum]

list numinbox

           VARIABLE : ISINBOTHBOXES[Z=@SUM]
            SUBSET   : 2 by 2 points (X-Y)
            Z        : 0.5 to 3.5
            1      2
            1      2
1   / 1:  2.000  0.000
2   / 2:  0.000  1.000

Russ

On Thursday 01 September 2011 15:23, William S. Kessler wrote:
I have a long list of data triplets (x,y,value) that I am putting on a regular grid. No problem doing that, but how can I count the number ofdata points that fall in each gridbox? I want to end up with a gridded field whose values are the number of the original (x,y) points within each box. It seems like a simple task, but I can't think of a way to do it without a (double) repeat loop, or sorting and writing data out (twice). Ugly. Anyone have a straightforward way to do this?Frustratingly, the function SCAT2GRID_BIN_XY produces the bin- average.To do that it must compute the number of points in each bin. That number should be available to the user. Thanks ... Billy K
Attachment:
PointsInCell.jnl
Description: Binary data