On Fri, Apr 15, 2011 at 7:53 PM, Steve Hankin <Steven.C.Hankin@xxxxxxxx> wrote:
Hi Peter,
To get your calculation to complete without error you need only regrid your 1 year (365.2425 day long) climatology back onto the Gregorian calendar.� Simply replace the definition��� let t2m_anom=t2m-t2m_climwith
��� let t2m_anom=t2m-t2m_clim[gt=tm2@LIN]
Note that @LIN is the default ... shown here just to emphasize that linear interpolation is used.
Here's the background.� A daily climatology is not a clean problem no matter how you slice it.� I suppose your intent for a "daily climatology of 366 days" might be that the final result contains a Feb. 29 date, which is computed from 1/4 as many input points as all other days. � Ferret will not readily calculate things this way (though I imagine it could be forced to do so with sufficient torture applied� ;-) ).�� For better or worse, Ferret's regridding algorithm between calendar types doesn't regard the proclamations of Pope Gregory as scientifically based.� (The logic being that in a leap year the earth does not actually take an additional day to revolve around the sun.) � Instead they regard each individual year (1961, 1962, ...) as representing the same time interval, regardless of how the calendar may divide it into days.�� I offer this just as background.�� (It can play havoc with daily (24 hour) climatologies!)
Here is a script to illustrate.� (Note:� For this email list it is helpful to pose questions and solutions that do not depend on access to particular files.)
define axis/t=1-jan-1961:31-dec-1990:1/unit=days tlong
let myvar = RANDU(T[gt=tlong])������ ! a dummy data variablelet myvar_clim=myvar[gt=daily1@mod]
def axis/t=0:365.2425/edges/npoints=365/t0=1-JAN-0001/units=days/modulo daily1
let myvar_anom=myvar-myvar_clim[gt=tlong]
set region/t=1-jan-1980:31-dec-1980
set view upper
plot myvar, myvar_clim
set view lower
plot myvar_anom
On 4/15/2011 3:07 AM, Peter Szabo wrote:Hey,
I would like to get daily climatology for 366 days (including Feb 29), then final goal is getting daily anomalies through multiple years (also containing Feb 29s). It works for 365-day climatology.Sorry for the re-post.
Thanks for the help, Peter
On Wed, Apr 13, 2011 at 10:56 AM, Peter Szabo <szabpet83@xxxxxxxxx> wrote:
Dear Users,
I try to count anomaly from daily climatology through multiple years.It is a 30-year data set with a normal Gregorian calendar axis:
yes? sh axis treal�name � � � axis � � � � � � �# pts � start � � � � � � � �end�TREAL � � TIME � � � � � � 10957 r � 01-JAN-1961 12:00 � �31-DEC-1990 12:00T0 = 01-JAN-1961 00:00:00
I define the modulo time axis, then I count daily climatology, finally I extract it from my time series:
def axis/t=0:365.2425/edges/npoints=365/t0=1-JAN-0001/units=days/modulo daily1let t2m_clim=t2m[gt=daily1@mod]let t2m_anom=t2m-t2m_clim
The problem is that it does not take into account February 29s, and thus it gives an error:�**ERROR: inconsistent sizes of data regions: T axis�� � � � �T2M61A has 10950 points (L=00001:10950)�� � � � �_expression_ has 10957 points (L=00001:10957)
If I reduce my t2m to 10950 days (in order to simulate "skipping" february 29s), It does the extraction, though, some tiny bias might occur as a consequent of this.It raises some further questions:
Why do not the following two take feb 29s into account? The daily2 is almost the same as daily1. Furthermore, the daily3 axis is giving a totally different result.def axis/t=0:365.2425/edges/npoints=366/t0=1-JAN-0001/units=days/modulo daily2def axis/t=0:365.2425:1/edges/t0=1-JAN-0001/units=days/modulo daily3
If I define my modulo axis to skip feb 29, it gives obviously bad results.def axis/t=0:365/edges/npoints=365/t0=1-JAN-0001/units=days/modulo daily4
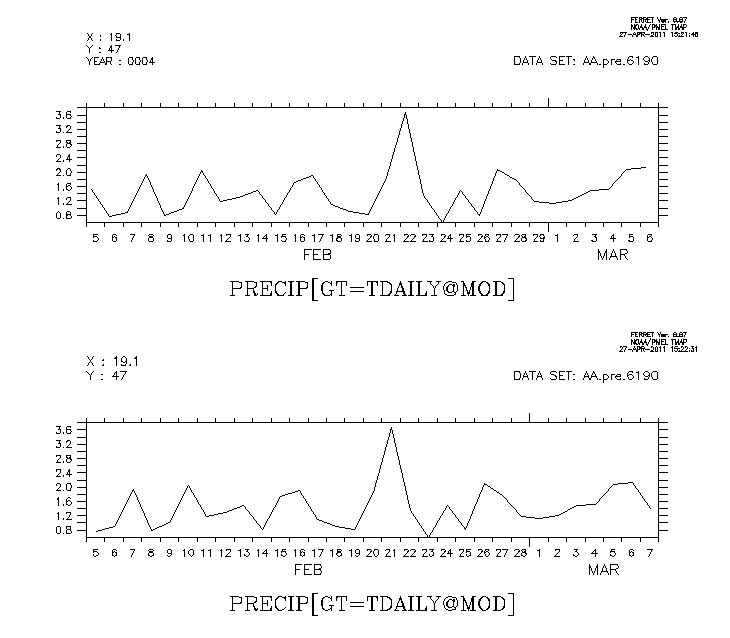
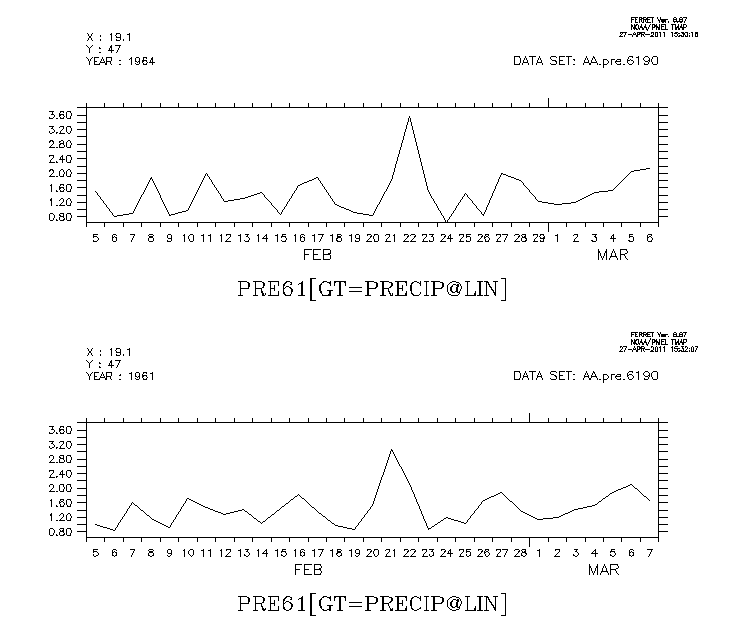
I enclose a plot with the 4 daily climatological axes.Which one is correct? Why is there huge difference between the axes? How can I make a daily climatology which takes into account February 29?
Thanks in advance,
Peter Szabo