[Thread Prev][Thread Next][Index]
Re: [ferret_users] Ensemble mean with envelope plot
Neil Swart a écrit :
Dear Ferreters,
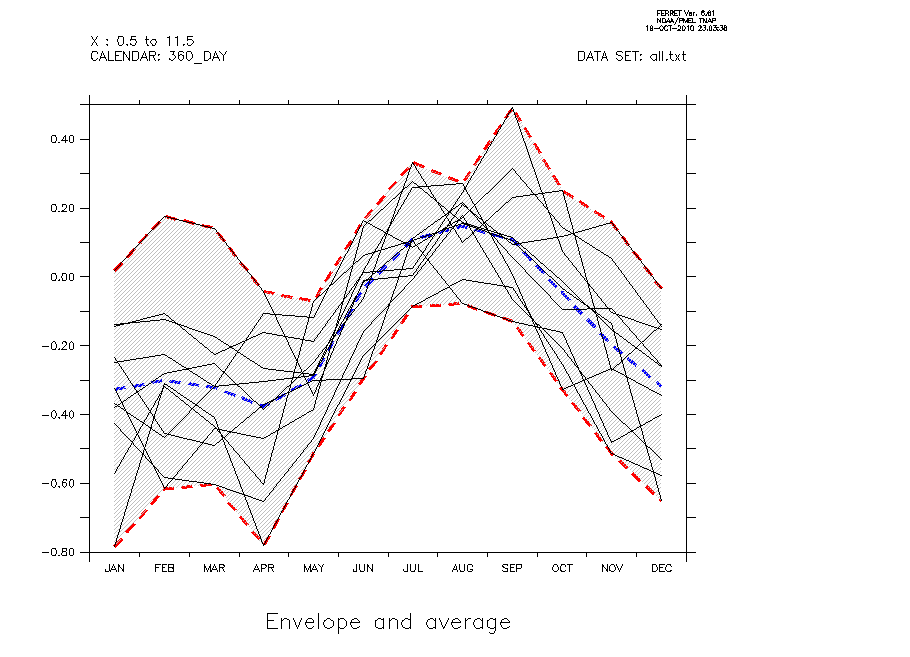
I have a 1-d output, lets say a time series of global average SAT from 10 models, each in its own file.
I want to produce a plot that shows the ensemble mean, and has a shaded envelope surrounding the mean, to show the maximum and minimum (like often seen in IPCC reports for example here: http://www.ipcc.ch/graphics/ar4-wg1/jpg/fig-10-4.jpg).
Does anyone know the best way to do this? A contour fill perhaps?
Hi,

Here is an example you can derivate.
The difficulty is that you need an intermediate file to compute min,
max, average over
all the models.

Hope that will help you
Patrick

--
LSCE/IPSL, Laboratoire CEA-CNRS-UVSQ
Data Analysis and Visualization Engineer
IPSL Global Climate Modelling Group
--

!================================================
use monthly_navy_winds.cdf

let a=UWND[i=@ave,j=@ave]

def axis/t="01-JAN-0000":"30-DEC-0000":1/units=months/cal=360_days/edges mytaxis

! Create BY82, BY83 ... variables
repeat/l=1:132:12 ( let AY`82+(l-1)/12`=tsequence(A[L=`l`:`l+11`]) ; let/title="Year `82+(l-1)/12`"  BY`82+(l-1)/12`=AY`82+(l-1)/12`[gt=mytaxis@ASN] )

! We have now 11 variables (considered as models)
plot/d=1/sym=3/line=1 BY82, BY83, BY84, BY85, BY86, BY87, BY88, BY89, BY90, BY91, BY92

!================================================
! Save all as columns text
list/clobber/nohead/norowlab/file="all.txt" BY82, BY83, BY84, BY85, BY86, BY87, BY88, BY89, BY90, BY91, BY92

!================================================
def sym nbmodel=11
def axis/X=1:($nbmodel):1 modelaxis
def grid/X=modelaxis/T=mytaxis mygrid

file/grid=mygrid/col=($nbmodel)/var=model all.txt

let model_max=model[i=@max]
let model_min=model[i=@min]
let model_ave=model[i=@ave]

plot/over/nolab/color=2/dash/d=2/thick=3 model_min, model_max
plot/over/nolab/color=3/dash/d=2/thick=3 model_ave

!================================================
! Now some comestics
pause
plot/color=2/dash/d=2/thick=3/title="@ASEnvelope and average" model_min, model_max
plot/over/nolab/color=4/dash/d=2/thick=3 model_ave
go fill_between poly/over/nolab/palette=gray_light/pattern=dark_up_left_to_right tsequence(model_min) mytaxis tsequence(model_max)
plot/over/nolab/d=1/line=1 BY82, BY83, BY84, BY85, BY86, BY87, BY88, BY89, BY90, BY91, BY92
[Thread Prev][Thread Next][Index]
Contact Us
Dept of Commerce /
NOAA /
OAR /
PMEL /
TMAP
Privacy Policy | Disclaimer | Accessibility Statement
