[Thread Prev][Thread Next][Index]
[ferret_users] contour/fill and contour/line - different algorithm?
Hi all,
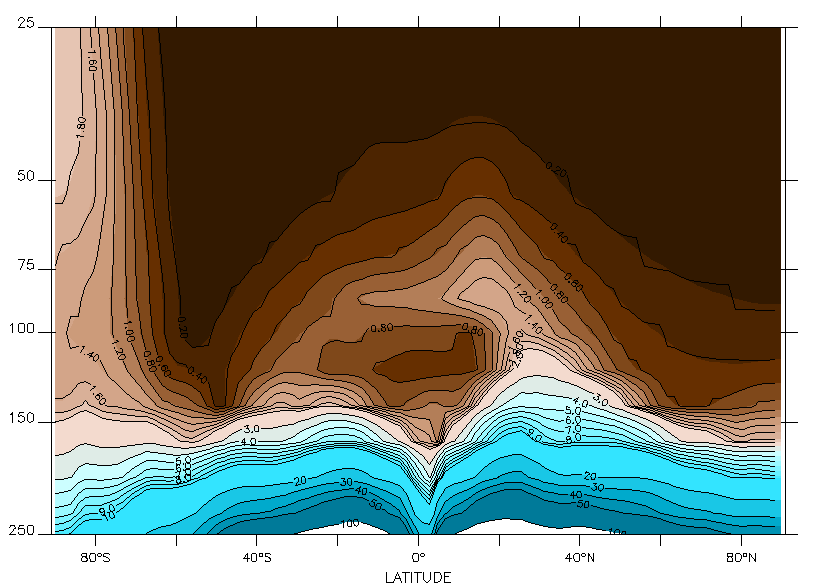
I've been doing some plots where I do a "fill" with a "contour/line"
over the top. This has worked out fine for the most part, but today
I've been trying it on some data where I transform the pressure axis
to log pressure. In essence, the problem is that the contour lines do
not line up with the shading, mostly at higher altitudes. (see
attached) The vertical model levels are certainly more spread out
there, but I would have guessed that the contour/line would still
follow contour/fill.....
Commands follow:

use my_water_vap_climatology.nc 							!Model water vapor output
define axis/depth/from_data/name=lnpz/z ln(z[gz=my_data]) !Put on log
pressure axis
let x_lnp = my_data[gz=lnpz@asn]

let zmin = 250											!Set up plot (range and axes etc)
let zmax = 25
ppl axlabp -1, 0
ppl tics 0.125, 0.25, 0, 0

set region/z=`ln(zmin)`:`ln(zmax)`
fill/lev=($my_levels)/nokey \
  (x_lnp[l=@max]-x_lnp[l=@min]) 						 	!Contour/fill yearly range
contour/over/nolab/lev=($lv) \
(x_lnp[l=@max]-x_lnp[l=@min]) !Over plot contour lines -
PROBLEM HERE?!
Thanks for any pointers,

Paul
[Thread Prev][Thread Next][Index]
Contact Us
Dept of Commerce /
NOAA /
OAR /
PMEL /
TMAP
Privacy Policy | Disclaimer | Accessibility Statement