[Thread Prev][Thread Next][Index]
[ferret_users] how can I plot this type of figure?
- To: ferret_users@xxxxxxxx
- Subject: [ferret_users] how can I plot this type of figure?
- From: golla nageswararao <ezeenag4u@xxxxxxxxx>
- Date: Fri, 24 Sep 2010 18:43:29 +0530
- Dkim-signature: v=1; a=rsa-sha256; c=relaxed/relaxed; d=gmail.com; s=gamma; h=domainkey-signature:mime-version:received:received:date:message-id :subject:from:to:content-type; bh=jLnpDQBA4EKzhszKTdoAulUAwEo41/OY0KVOnuOMZNk=; b=L5mck71gHS1QgWwb2ir7Z9LLx4cOJ5pDaDR1Qq92EZKjUqMG7ADv0xBN20DuWH0lrv TWc3hmic9EJGNDs3KZu2ETgw/QloE3Ok8s8RU4f3AWiU2SVW1ROq44z0O2OIK0YRZzkh ypre7ZyyogIAMfawyP+0wx48R7k2jlOharod4=
- Domainkey-signature: a=rsa-sha1; c=nofws; d=gmail.com; s=gamma; h=mime-version:date:message-id:subject:from:to:content-type; b=FpLF2PJKkqMnmn6o/S4RHV5+8L7HA7em8e8GVOql3H1/qmF+lNMCOEkTl7Jt94uu44 yK/8vsOMO7XGUqhKLO+WXPsFZdcUpQnOVeaHyUOilFtfhH/H6YWEjTdf8yxxIq+TcVfE zpLTKBmEv9FpDFetmVLGQq0FCecW/hZ36u3q0=
- Sender: owner-ferret_users@xxxxxxxx
Hi all.
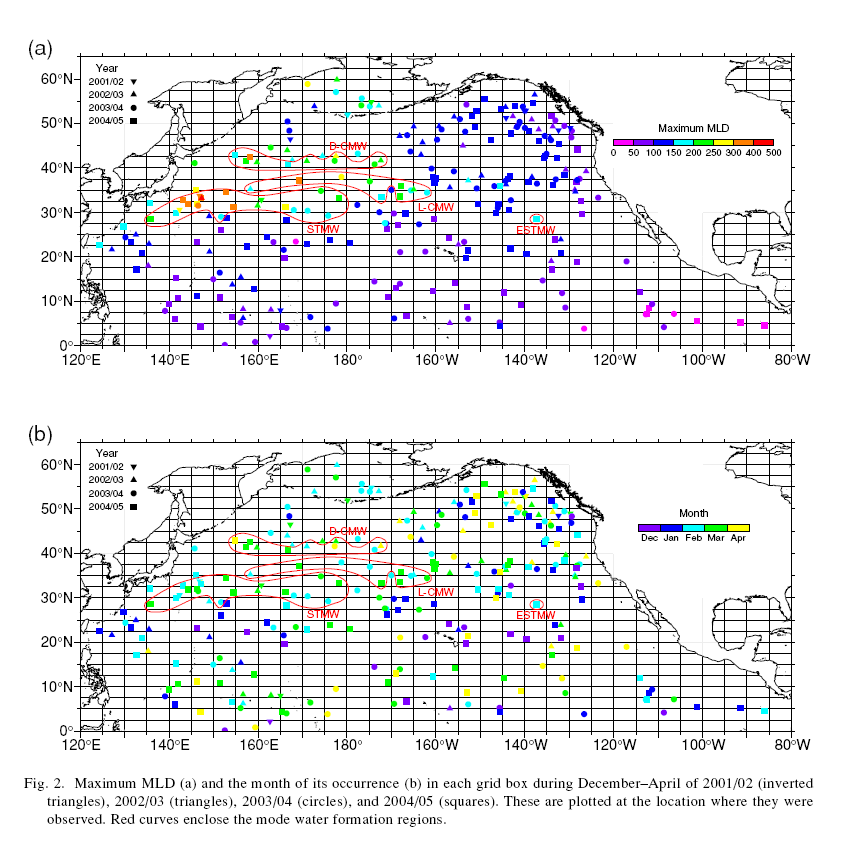
I am having mld data with lat, lon and time, I want to plot like attached figure. Help me in this regard.
Thanks in advance.
--
With Best regards,
G.NageswaraRao.
Attachment:
mld.png
Description: PNG image
[Thread Prev][Thread Next][Index]
Contact Us
Dept of Commerce /
NOAA /
OAR /
PMEL /
TMAP
Privacy Policy | Disclaimer | Accessibility Statement