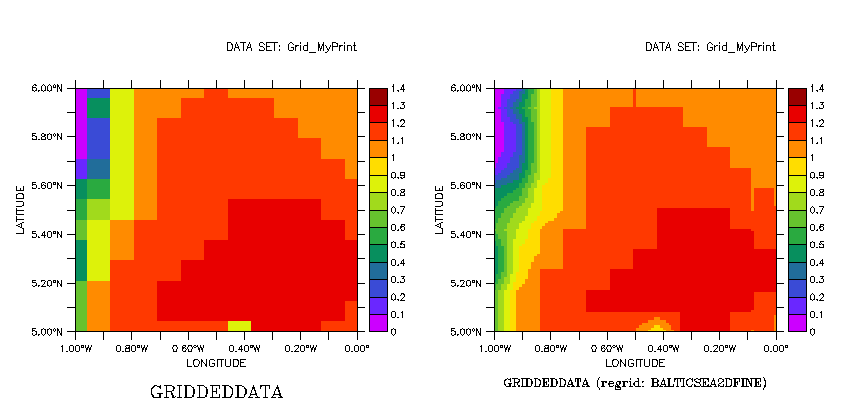
This is not a problem with the regridding but with the way this low-resolution data is interacting with the color levels used for the plots.
The original data doesn't have much resolution; each value has only 1 or 2 digits with values of 0.5, or 1.3, and so on. So it turns out that the plot you'll see will depend a lot on the color levels you choose.
A general suggestion is to use the SHADE command instead of FILL for investigating color plots - it helps you see the grid and I find it's easier to see what's happening (then switch back to FILL if you like). I used a similar number of levels here,
yes? set win/asp=0.5
yes? set view left
yes? shade/x=1W:0/y=5:6/lev=(0,1.4,0.1) GriddedData
yes? set view right
yes? shade/x=1W:0/y=5:6/lev=(0,1.4,0.1) GriddedData[gxy=BalticSea2Dfine@lin]

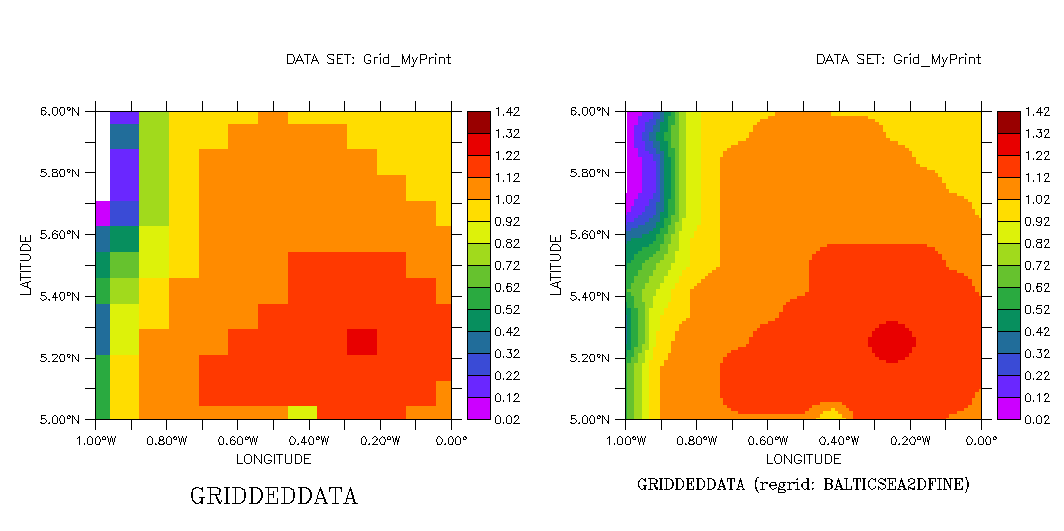
The values of the interpolated data are now numbers like 0.575, 0.55, 0.525, again a limited set of values that happen to be binned into the chosen color levels in a way that looks as if nothing has happened. Now try these levels, which don't line up with the data values.
yes? cancel viewports
yes? set view left
yes? shade/x=1W:0/y=5:6/lev=(0.02,1.4,0.1) GriddedData
yes? set view right
yes? shade/x=1W:0/y=5:6/lev=(0.02,1.4,0.1) GriddedData[gxy=BalticSea2Dfine@lin]

... or better yet, try the /LEVELS=V variance-based color levels.
-Ansley
On 8/4/2010 6:07 AM, Szymon Roziewski wrote:
Hello everybody,
I wanted to regrid my data. I attach two files as attachments to this e-mail.
The first.gif is done by that script (this is when no regridding is applied):
set win/size=6.0/aspect=`1`
CANCEL MODE LOGO
DEFINE AXIS/X=-5.666666667:5.25:0.083333333/unit=degree xlon
DEFINE AXIS/Y=-2.0:10.0:0.083333333/unit=degree ylat
DEFINE AXIS/X=-5.666666667:5.25:0.010416667/unit=degree xfine
DEFINE AXIS/Y=-2.0:10.0:0.010416667/unit=degree yfine
FILE/VARIABLES=GriddedData/COLUMNS=132/GRID=BalticSea2D Grid_MyPrint
fill/title="Significant Wave Height 20 July 2010 23:00:00"/PALETTE=my_palette_swh/lev=12 GriddedData[l=@ave]
contour/over/nolab/lev=(1.0) GriddedData[l=@ave]
contour/over/nolab/lev=(1.2) GriddedData[l=@ave]
contour/over/nolab/lev=(1.5)/color=blue GriddedData[l=@ave]
frame/file=Significant_Wave_Height_20_July_2010_230000.gif
and the second.gif by this (with regridding but not I am not satisfied):
set win/size=6.0/aspect=`1`
CANCEL MODE LOGO
DEFINE AXIS/X=-5.666666667:5.25:0.083333333/unit=degree xlon
DEFINE AXIS/Y=-2.0:10.0:0.083333333/unit=degree ylat
DEFINE AXIS/X=-5.666666667:5.25:0.010416667/unit=degree xfine
DEFINE AXIS/Y=-2.0:10.0:0.010416667/unit=degree yfine
DEFINE GRID/x=xlon/y=ylat BalticSea2D
DEFINE GRID/x=xfine/y=yfine BalticSea2Dfine
FILE/VARIABLES=GriddedData/COLUMNS=132/GRID=BalticSea2D Grid_MyPrint
fill/title="Significant Wave Height 20 July 2010 02:00:00"/PALETTE=my_palette_swh/lev=12 GriddedData[gxy=BalticSea2Dfine@lin]
contour/over/nolab/lev=(1.0) GriddedData[gxy=BalticSea2Dfine@lin]
contour/over/nolab/lev=(1.2) GriddedData[gxy=BalticSea2Dfine@lin]
contour/over/nolab/lev=(1.5)/color=blue GriddedData[gxy=BalticSea2Dfine@lin]
frame/file=Significant_Wave_Height_20_July_2010_020000.gif
I also send the file Grid_MyPrint.
What I should do in order to get a proper picture with smooth contours and shapes?
Any solution will be appreciated!
--
Best regards,
Szymon Roziewski