Ferret can handle this dataset as-is. The grid is a "curvilinear" grid, with the longitude and latitude coordinates expressed as 2-D arrays. In fact, this kind of grid falls under the CF conventions, http://cf-pcmdi.llnl.gov/, as a dataset with "Two-Dimensional Latitude, Longitude Variables". In the Ferret documentation look up topics under "curvilinear" in for how to do graphics with curvilinear grids. For instance,
yes? fill/L=1 va,lon,lat
If you like, there are also functions you could use to regrid the data to a rectilinear grid (1-dimensional X and Y axes). These are CURV_TO_RECT_MAP and CURV_TO_RECT.
LAS is also able to do visualizations and subsetting of data on their native curvilinear grids, if the dataset is correctly configured. In the instructions for installing LAS, there is a section about "Adding Curvilinear Data". In addition, the most recent version of AddXML can create a LAS configuration for many of these kinds of grids. Here is a message about this topic from the LAS Users' List; this is part of a longer thread that may be useful to you.
http://www.pmel.noaa.gov/maillists/tmap/las_users/fu_2010/msg00011.htmlAnsley
Anton Yoel Buenavista wrote:
Greetings to everyone,
Does Ferret have any facilities to transform a non-standard-convention (i.e. non-CF) gridded netcdf file into a CF-convention one? We'd like to do this so that the files can be easily managed by LAS or other netcdf-friendly software. Specific details below.
Our netCDF file in question does not use lon,lat axes but a rectangular Cartesian grid. However, each grid point is indexed to a lon,lat coordinate. To illustrate, the "ncdump -h" of the netCDF file is at the bottom of this e-mail.
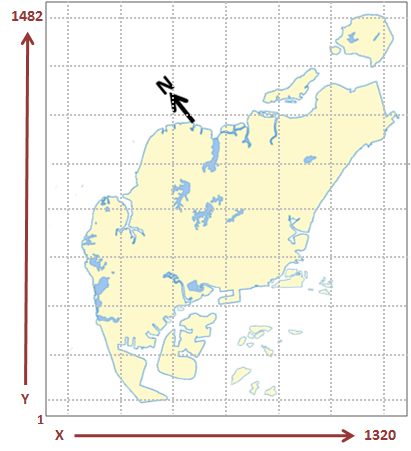
When we plot the netCDF file we get the plot as seen on Figure A below, where the North is not vertically upwards. We'd like to transform this into a regular lon-lat grid.
Fig. A
Any pointers would be most appreciated.
--------- start ncdump -h ---------------
netcdf hydro_avged_2D {
dimensions:
time = UNLIMITED ; // (84 currently)
xaxis = 1320 ;
yaxis = 1482 ;
zaxis = 1 ;
variables:
double time(time) ;
time:long_name = "coordinate variables of time" ;
time:units = "second since 2008-01-22" ;
time:figure = "na" ;
float h(yaxis, xaxis) ;
h:long_name = "distance from still water level to sea bed" ;
h:units = "meter" ;
h:figure = "scalar_h" ;
h:_FillValue = 9.96921e+36f ;
float lon(yaxis, xaxis) ;
lon:long_name = "longitude(east)" ;
lon:units = "degrees_east" ;
lon:figure = "na" ;
lon:_FillValue = 9.96921e+36f ;
float lat(yaxis, xaxis) ;
lat:long_name = "latitude(north)" ;
lat:units = "degrees_north" ;
lat:figure = "na" ;
lat:_FillValue = 9.96921e+36f ;
float mask(yaxis, xaxis) ;
mask:long_name = "computational mask. 1 is a computational cell, 0 is a land cell." ;
mask:units = "none" ;
mask:figure = "mask" ;
mask:_FillValue = 9.96921e+36f ;
float e(time, yaxis, xaxis) ;
e:long_name = "water surface elevation from still water level" ;
e:units = "meter" ;
e:figure = "scalar" ;
e:_FillValue = 9.96921e+36f ;
float va(time, yaxis, xaxis) ;
va:long_name = "depth averaged current speed along y-axis" ;
va:units = "meter/second" ;
va:figure = "vector_y" ;
va:_FillValue = 9.96921e+36f ;
float ua(time, yaxis, xaxis) ;
ua:long_name = "depth averaged water current speed along x-axis" ;
ua:units = "meter/second" ;
ua:figure = "vector_x" ;
ua:_FillValue = 9.96921e+36f ;
}
--------- end ncdump -h ---------------
--
Regards,
Anton Yoel Buenavista