I think we could probably do this but first I want to understand more about your grid. Is your grid actually curvilinear in longitude-time? Or are you thinking of plots using the 2-dimensional longitude coordinates from a grid that is curvilinear in xy and a time variable that is somehow generated?
If the curvilinear nature of the grid is in the horizontal dimensions, then to make a Hovmoller plot in X-T, I think you'd want to use the curvilinear sampling function, SAMPLEXY_CURV, to get a subset of the data at a particular latitude, and then plot that. So if your data looks like
yes? show datayou could define some longitude and latitude pairs to sample:
currently SET data sets:
1> ./curvi_data.nc (default)
name title I J K L
U zonal current 1:360 1:180 1:1 1:123
GEOLON longitude 1:360 1:180 ... ...
GEOLAT latitude 1:360 1:180 ... ...
let xpts = x[x=2:360:2]This would return U sampled at each of the longitude-latitude locations (2,31), (4,31) , ... (360,31), for all times on the time axis of U. The result of the function is on an abstract axis in the X direction, so you would need to define the equivalent longitude axis, and put u_at_31N onto that axis, and then you could plot it as a longitude-time plot with the regular 1-argument plot commands.
let ypts = 0* xpts + 31.
let u_at_31N = samplexy_curv(u, geolon, geolat, xpts, ypts)
Ansley
Brockmann Patrick wrote:
Hi all,
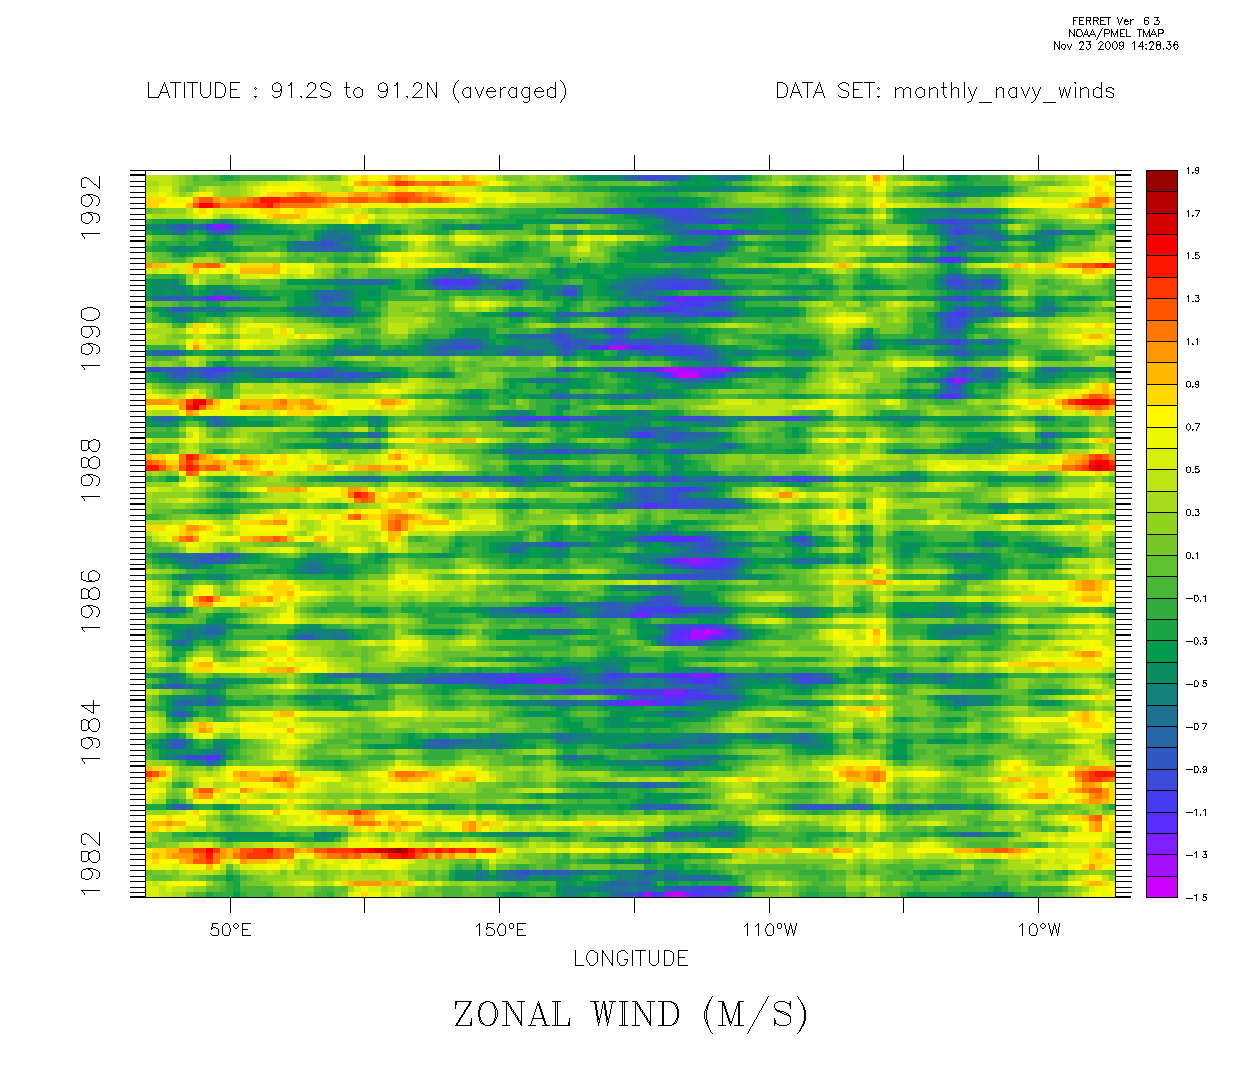
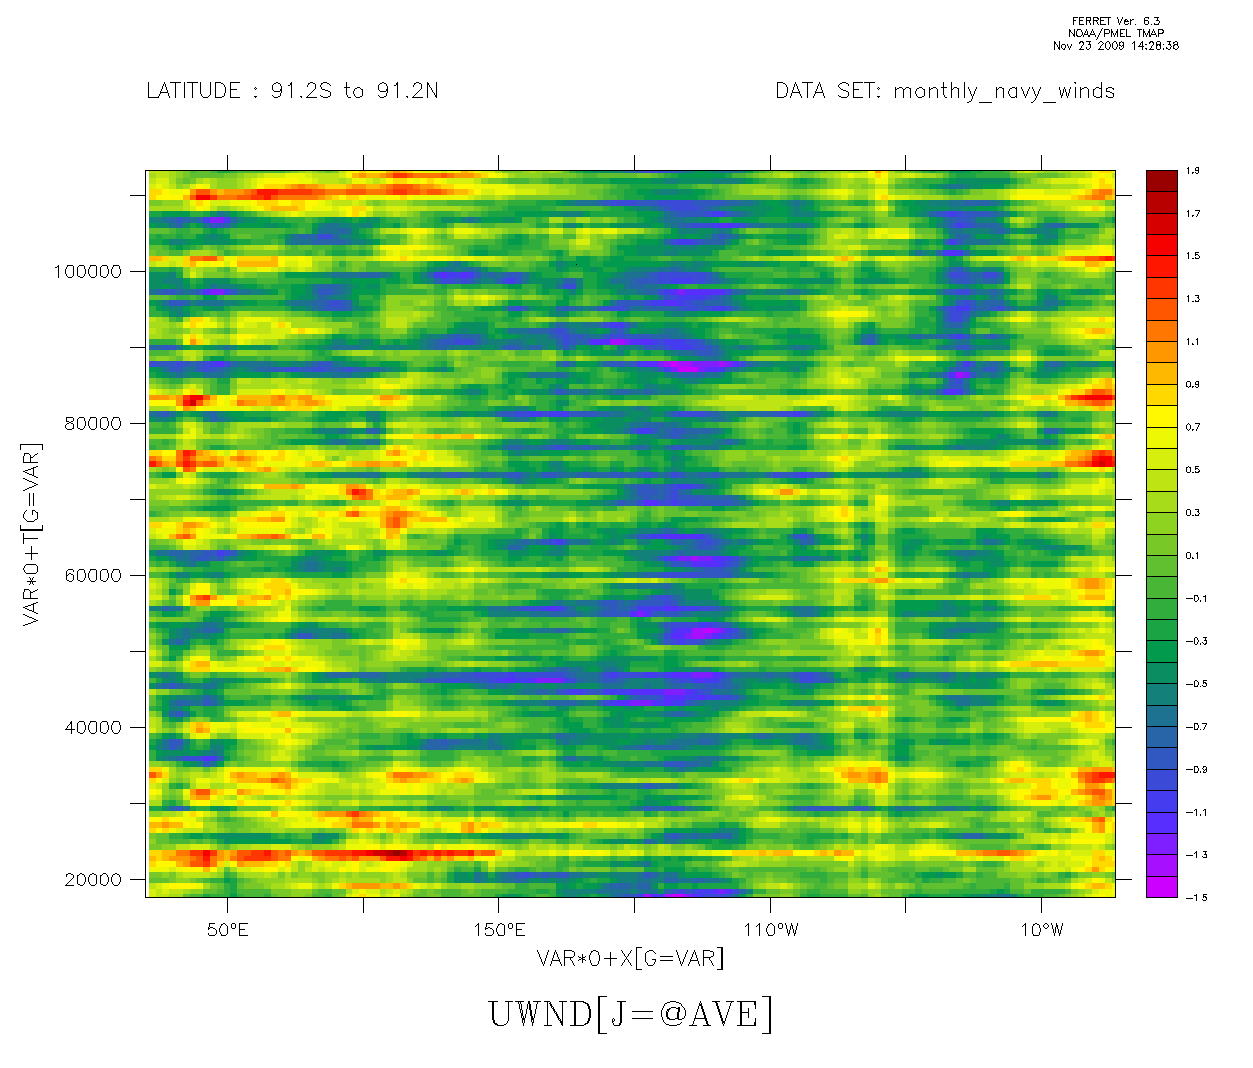
Is there a way to activate time labeling when a shade command is used with 3 args ?
It would be usefull to plot hovmoller plot from curvilinear model output.
Attached is a script using classic navy_winds netcdf file to simulate the problem.
Thanks
Patrick