[Thread Prev][Thread Next][Index]
[ferret_users] /VLOG with contour
Hi all,
I can read from documentation at
http://ferret.pmel.noaa.gov/Ferret/documentation/users-guide/commands-reference/CONTOUR
CONTOUR
/I/J/K/L /X/Y/Z/T /D /FILL /FRAME /KEY /LEVELS /LINE /NOAXIS /NOKEY
/NOLABEL /OVERLAY /PALETTE /PATTERN /SIZE /SPACING /SIGDIG /PEN /SET_UP
/TITLE /COLOR /TRANSPOSE /HLIMITS /VLIMITS /HLOG /VLOG /AXES /HGRATICULE
/VGRATICULE /GRATICULE /MODULO
==> read /HLOG /VLOG are present in this list
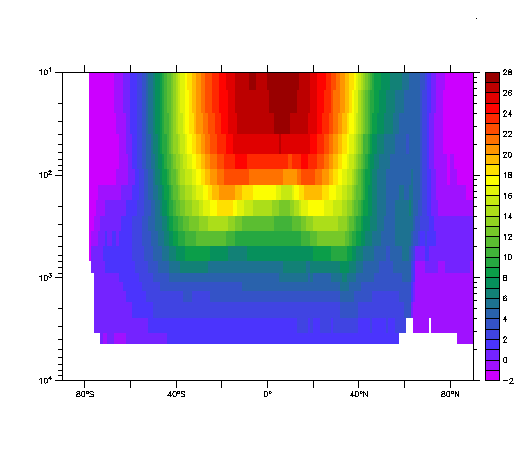
Does that means that it is now possible to draw a zonal mean
using a log vertical axis for example ?

For now, I do the label by myself using 2 frames one over the other.
First to plot with the vertical log axis without label, the second with
log labels from a plot command
that has a /vlog qualifier.
Run the script attached to get a demo.
yes? go shade_log.jnl 10 1000

By the way, it would be nice to be able to define a viewport as a copy from
another viewport.
Something as:
define viewport/like=full full_bis

Patrick

! go shade_log.jnl 10 10000

!====================================
use levitus_climatology

!====================================
let var=temp[i=@ave]

def sym vmin=($01%10%)
def sym vmax=($02%10000%)

!====================================
! classic plot
set w 1
shade/nolab/vlim=($vmin):($vmax) var

!====================================
! vertical log axis
set w 2
def viewport/xlim=0:1/ylim=0:1/text=1.0 FULL_BIS

!====================================
define axis/from_data/z/depth/units="METERS"/edges myzlog=log(ZBOXLO[GZ=ZAXLEVITR])
let var_log=var[gz=myzlog@asn]

!====================================
set v full
shade/nolab/axes=(1,1,0,0)/vlim=`log(($vmin))`:`log(($vmax))` var_log

!====================================
set v full_bis
plot/nolab/vlog/vlim=($vmin):($vmax)/axes=(0,0,1,1)/nolab z[g=var_log]*0-1E34
[Thread Prev][Thread Next][Index]
Contact Us
Dept of Commerce /
NOAA /
OAR /
PMEL /
TMAP
Privacy Policy | Disclaimer | Accessibility Statement
