Hi all,
The patterns are a built-in feature of the underlying graphics package xgks, which Ferret uses for most of its graphics. They're unfortunately not something the user can create more of. If you look at what's in the pattern files, you'll see that they contain only the name of the pattern; for instance,
% cat $FER_DIR/ppl/fish_scale.pat
1 FISH_SCALE
The pattern capability works in default Ferret interactive mode and in batch metafile mode, and in interactive mode you can do a FRAME/FILE=filename.gif which captures the screen output in a gif file. The patterns are not available in gif mode or in the batch mode started with a postscript filename, because that mode actually calls a separate underlying graphics package, the GD library. So, patterns work in these modes:
> ferretbut not with these:
(where you get hardcopy by setting a metafile, or executing a FRAME/file=name.gif command)
> ferret -batch my_metafile.plt
> ferret -batch
(with hardcopy by setting a metafile)
> ferret -gifOne way to get this effect is by overlaying a set of points plotted with PLOT/VS/OVER or with polygons. These look good when done as metafiles, or when produced in gif mode:
> ferret -batch my_psfile.ps
! Define a mask for a region that we will fill in with points
yes? use coads_climatology
yes? let mask1 = if sst gt 25 then 1
yes? let mask = if mask1 le 30 then 1
! points at all the coordinate locations; these could be defined differently for
! more or fewer dots, see the end
yes? let lon = x[gx=sst] + 0*y[gy=sst]
yes? let lat = 0*x[gx=sst] + y[gy=sst]
yes? set win/siz=1.5
yes? shade/L=1 sst
yes? plot/vs/over/L=1/sym=dot mask* lon, mask*lat
yes? frame/file=dots.gif
! Or use polygons:
yes? shade/L=1 sst
yes? go polymark poly/pal=black/over xsequence(lon), xsequence(lat), xsequence(mask[L=1]), circle, 0.2
yes? frame/file=circles.gif
To make fewer dots:
yes? let nx = `sst,return=isize`
yes? let ny = `sst,return=jsize`
yes? let lon = x[gx=sst,i=1:`nx`:2] + 0*y[gy=sst,j=1:`ny`:2]
yes? let lat = 0*x[gx=sst,i=1:`nx`:2] + y[gy=sst,j=1:`ny`:2]
yes? let mask1 = if sst[i=1:`nx`:2,j=1:`ny`:2] gt 25 then 1
Paul Young wrote:Hi all,
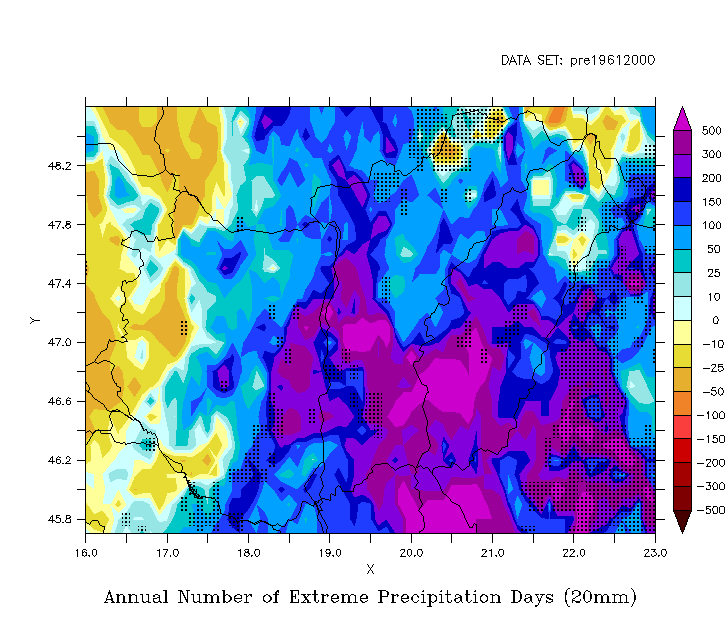
I'm trying to produce a difference plot where I highlight areas of significant difference - sort of like this plot from the recent IPCC report:
I've managed to get something similar using a "shade/over/pattern=" command, but none of the patterns has a stippling effect, or lets me edit them in Illustrator. Has anyone succeeded with anything like this in ferret before? EIse, is it possible to write my own pattern file to get the stippling?
Thanks for any help,
Paul
-----Paul YoungChemistry & Climate ProcessesChemical Sciences DivisionNOAA/ESRL325 Broadway R/CSD8BoulderCO 80305USA
Attachment:
trend_HUG_rr20.gif
Description: GIF image