[Thread Prev][Thread Next][Index]
Re: [ferret_users] surface plot - using POLYGON
Hi Golla,
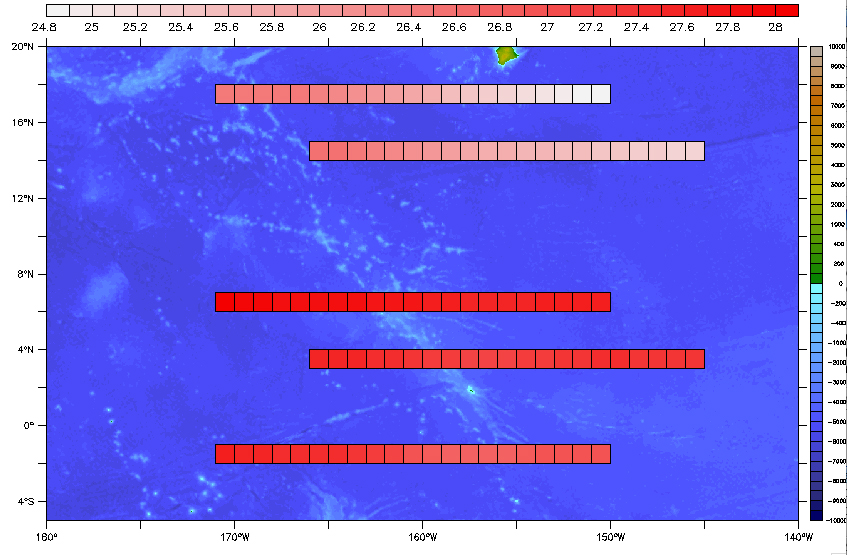
Here is a method that might work for you. The type of result is
shown in the attached image where I've used the Smith-Sandwell
bathymetry as a background on which to plot strips showing the surface
temperature (from Levitus) along each of 5 zonal sections.
   Hope it helps,
      Mick
PS There are other ways to do it of course. There is the POLYMARK
script, or you could just write the surface temperatures to an ASCII
file on a suitable grid, with missing values where necessary, then read
the file back and use SHADE. But if you get used to POLYGON it turns
out to be very flexible for generating other plots ... like histograms.
--------------------------------------
Step 1: Read in your 5 datasets and determine the range of latitude and
longitude needed to include them all, and also the overall range of
temperature at the depth level you want. For the demo I've extracted
data from the Levitus climatology so each point represents a 1x1 degree
area of the variable "temp"
use zone1.nc ; use zone2.nc ; use zone3.nc ; use zone4.nc ; use zone5.nc
let t0=temp[k=1]    ! temperature at  the depth you require
set data 1 ; sho grid/all temp ; list/nohead t0[x=@min],t0[x=@max]
...
set data 5 ; sho grid/all temp ; list/nohead t0[x=@min],t0[x=@max]

Step 2: Make the background plot - bathymetry with suitable aspect ratio

use smith_sandwell_topo  ! or some other topo file you use
ppl axlen,12,7.565 ; ppl size,14,9.565 ; ppl origin,1,1
shade/nolab/pal=dark_land_sea/lev=(-10000,10000,500)(-500,500,100)/x=180:220/y=-5:20
rose
Step 3 : Each value is going to appear as a colored rectangle, centered
on the lat,lon of the point it represents, so what we need is to define
the center points ...
let xx=x[g=t0] ; let yy=y[g=t0]
... and increments to the vertices (in my case a 1x1 box) surrounding
them. In your case, different increments in X and Y might be appropriate
(there are ways using XBOXLO... to generalize the process though the
script gets a bit harder to read)
let bx=tsequence({-0.5,0.5,0.5,-0.5}) ; let
by=tsequence({-0.5,-0.5,0.5,0.5})
(The four vertices were defined as a t-axis variable because the
datasets use x,y and z axes.)
Step 4: Now we are ready to go. Use the first point of the first
section to make the colorbar ...
here drawn across the top ...

set data 1
poly/o/nolab/pal=inverse_redscale/lev=(24.8,28.1,0.1)/coord=t/key/i=1/set
xx+bx,yy+by,t0
ppl shakey,,0 ; ppl fillpoly/over

then draw then entire set of 21 points for section#1
repeat/i=1:21
(poly/o/nolab/pal=inverse_redscale/lev=(24.8,28.1,0.1)/coord=t/line=1
xx+bx,yy+by,t0 ; ppl shaset reset)
then add the other 4 sections (all my sections had 21 longitudes, you
could change the value between sections if this were not so.
set data 2
repeat/i=1:21
(poly/o/nolab/pal=inverse_redscale/lev=(24.8,28.1,0.1)/coord=t/line=1
xx+bx,yy+by,t0 ; ppl shaset reset)
set data 3
repeat/i=1:21
(poly/o/nolab/pal=inverse_redscale/lev=(24.8,28.1,0.1)/coord=t/line=1
xx+bx,yy+by,t0 ; ppl shaset reset)
set data 4
repeat/i=1:21
(poly/o/nolab/pal=inverse_redscale/lev=(24.8,28.1,0.1)/coord=t/line=1
xx+bx,yy+by,t0 ; ppl shaset reset)
set data 5
repeat/i=1:21
(poly/o/nolab/pal=inverse_redscale/lev=(24.8,28.1,0.1)/coord=t/line=1
xx+bx,yy+by,t0 ; ppl shaset reset)
golla nageswararao wrote:
Hi,
I am having some 5 transects temperature data individually along
different latitudes with depth in different netcdf files. I want to
plot surface temperature (long vs lat) calling data at different
latitudes. All depth values are same. How can I do that in ferret?
/From,/

    /G.Nageswara Rao,/
    Scientist-'B',
    NPOL,
    Kochi.


------------------------------------------------------------------------
Unlimited freedom, unlimited storage. Get it now
<http://in.rd.yahoo.com/tagline_mail_2/*http://help.yahoo.com/l/in/yahoo/mail/yahoomail/tools/tools-08.html/>
[Thread Prev][Thread Next][Index]
Contact Us
Dept of Commerce /
NOAA /
OAR /
PMEL /
TMAP
Privacy Policy | Disclaimer | Accessibility Statement