Hi Peter,
First, about your first message where you had one month too few. The
definition gives you the start of each month and you need one more
point to be the end of the last month. I haven't tested this, but I
think it'd just be this in the commands you show:
LET indices = L[L=1:`nyears*12`] + 1
And, about the @sum regridding giving you a value of 3.5. That would
occur if the new axis overlaps a time step from the old axis by half a
grid cell. In your original message, you showed the axis. See how the
TBOXLO values show that they start at hour 12:
yes? sh axis/t=1-jan-1961:3-jan-1961 tax
name axis # pts start end
TAX TIME 14610 r 01-JAN-1961 00:00 31-DEC-2000
00:00
T0 = 15-JAN-1901 00:00:00
Axis span (to cell edges) = 350640
L T TBOX TBOXLO TSTEP
(HOURS)
1> 01-JAN-1961 00:00:00 24 31-DEC-1960 12:00:00
525624
2> 02-JAN-1961 00:00:00 24 01-JAN-1961 12:00:00
525648
3> 03-JAN-1961 00:00:00 24 02-JAN-1961 12:00:00
525672
That means that when we're regridding say, the data from the first of
January 1981 to the new axis, if your variable pre has a value of 1,
only half of that 1 will be added to the sum for the month January 1981
and half would be added to the month December 1980.
Ansley
Peter Szabo wrote:
Hello Friends,
Maybe im becoming annoying, but one more thing:
if i use trueyear time-axis for regriding a variable, then list the
original ones for the critical years i have different results.
------------------ its the definition of the trueyear-axis for 40
years. i checked: it works fine.
let start_year = 1960
let nyears = 41
let indices = l[l=1:`nyears`]
let year = start_year + indices
def ax/un=days/t0=1-jan-1900/ed trueyear = DAYS1900(year,1,1)
------------------ now i do the regriding
let prem=if pre[x=19.1,y=47.5,d=4] ge 20 then 1 else 0
let premx=prem[gt=trueyear@sum]
------------------ now i list the variable (the values should be
integer)
yes? list premx[l=20:21]
JUL-1981 / 20: 3.500
JUL-1982 / 21: 3.500
------------------ now i list the original variable with a sum
transformation for checking the latter variable, but its different (and
this seems to be correct, because its integer)
yes? list prem[t="1-jan-1980":"31-dec-1980"@sum]
TIME : 01-JAN-1980 00:00 to 31-DEC-1980 00:00 (summed)
3.000
yes? list prem[t="1-jan-1981":"31-dec-1981"@sum]
TIME : 01-JAN-1981 00:00 to 31-DEC-1981 00:00 (summed)
3.000
Does anyone know why this occurs?
Peter
On Wed, Nov 26, 2008 at 9:30 AM, Peter Szabo
<szabpet83@xxxxxxxxx>
wrote:
Hello
Ansley,
Thanks a lot for the help.
>From now on i should take care of these regridings and transformations
when i use both in one command, but its simpler and self-explanatory
when i use them seperately and one after an other.
And yes, i wanted to create a continuous monthly axis. (As you
suggested) In the users guide i found the precise axis i really needed:
! Define a 40 year monthly axis starting in Jan 1961
LET start_year = 1961


LET nyears = 40
LET indices = L[L=1:`nyears*12`]
LET month = MOD(indices-1,12)+1
LET year = start_year + INT((indices-1)/12)
DEFINE AXIS/UNITS=days/T0=1-jan-1900/EDGES truemonth = DAYS1900(year,month,1)
BUT, if i use the truemonth axis for regriding, i miss the last point
in time: i have created 479 instead of 480.
yes? sh axis/t=1-aug-2000:1-jan-2001 truemonth
name axis # pts start end
TRUEMONTH TIME 479 i 16-JAN-1961 12:00 16-NOV-2000
00:00
T0 = 1-JAN-1900
Axis span (to cell edges) = 14579
L T TBOX TBOXLO TSTEP
(DAYS)
475> 16-JUL-2000 12:00:00 31 01-JUL-2000 00:00:00
36721.5
476> 16-AUG-2000 12:00:00 31 01-AUG-2000 00:00:00
36752.5
477> 16-SEP-2000 00:00:00 30 01-SEP-2000 00:00:00
36783
478> 16-OCT-2000 12:00:00 31 01-OCT-2000 00:00:00
36813.5
479> 16-NOV-2000 00:00:00 30 01-NOV-2000 00:00:00
36844
Peter
On Tue, Nov 25, 2008 at 7:33 PM, Ansley
Manke
<Ansley.B.Manke@xxxxxxxx>
wrote:
Hi Peter,
The monthly axis you defined is a regularly-spaced axis, with grid
cells approximately one month in size, but the months will be centered
approximately on the first of each month. Do you want an axis with the
first cell representing all of January 1961 then all of February, and
so on? If so, then you would come closer to that if you did not use
the /edges qualifier. But to really do it right, try this: Look up
"monthly axis, creating" in the Users Guide index. It'll take you to
the section on DEFINE AXIS/EDGES, which has an example showing how to
define a set of values representing the start of each month, and then
using /EDGES to create a monthly axis where the edges are the
boundaries between months and the coordinate value is in the middle.
As to the results you're getting, when you specify both a
transformation, like X=@AVE,and a regridding operation, which in your
case is GT=tmonthly2@MAX, together in the same _expression_, Ferret does
the regridding first. As you found there's a difference between the
maximum in each month of all the data in the x and y range, vs the
maximum in each month of the data after averaging in x and y. A person
might want either result, so it's important to nail down in what order
you want operations you want to be done, as you did in making two
separate definitions.
Ansley
Peter Szabo wrote:
Hi ferreters,
one comment:
It looks proper, when i used any of the axes (now i used:
def axis/t="15-JAN-1961":"15-DEC-2000"/np=480/edges tmonthly2)
and
let prex=pre[x=@ave,y=@ave]
let premmax=prex[gt=tmonthly2@max]
instead of
let premmax=pre[x=@ave,y=@ave,gt=tmonthly2@max]
Sorry, i should have mentioned the "x=@ave,y=@ave" operations.
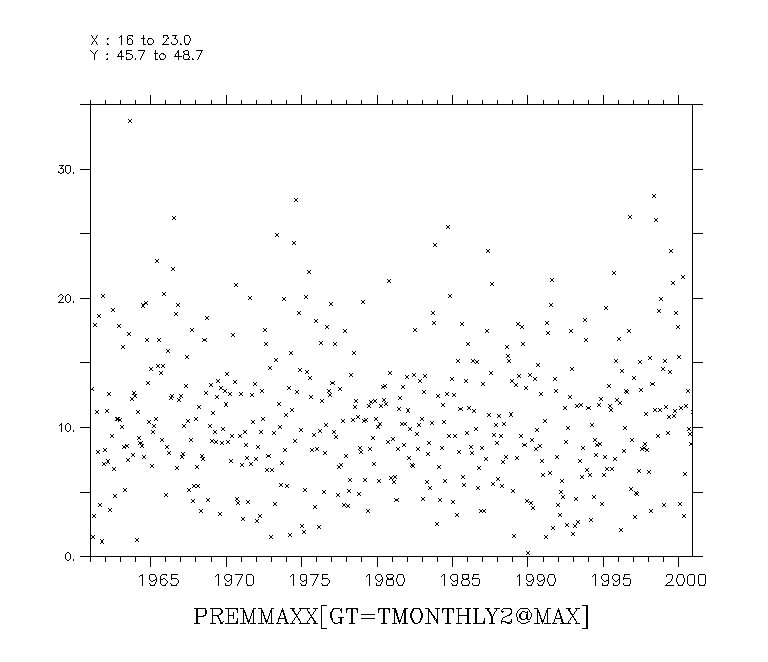
The given values seem to be correct (the maximum value on the attached
GIF are closer to the original GIF which was posted in my latter
letter), but
i still dont know if the used time-axis is appropriate
or not.
And i dont know
why i cant use the x=@ave, y=@ave and the
gt=tmonthly2@max regriding operations together.
Peter
On Tue, Nov 25, 2008 at 2:52 PM, Peter
Szabo
<szabpet83@xxxxxxxxx>
wrote:
Dear
Ferret Users,
Im totally confused about creating appropriate time-axes: i would like
to get monthly maximum precipitation from daily data set.
Here are some details of my original data set:
yes? sh axis/t=1-jan-1961:3-jan-1961 tax
name axis # pts start end
TAX TIME 14610 r 01-JAN-1961 00:00 31-DEC-2000
00:00
T0 = 15-JAN-1901 00:00:00
Axis span (to cell edges) = 350640
L T TBOX TBOXLO TSTEP
(HOURS)
1> 01-JAN-1961 00:00:00 24 31-DEC-1960 12:00:00
525624
2> 02-JAN-1961 00:00:00 24 01-JAN-1961 12:00:00
525648
3> 03-JAN-1961 00:00:00 24 02-JAN-1961 12:00:00
525672
When i try to find the monthly maximum value through regriding to
monthly data with the below command, i just cant have the correct
values.
def axis/t="15-JAN-1961":"15-DEC-2000"/np=480 tmonthly
let premmax=pre[gt=tmonthly@max]
I also tried creating the time axis with "/edges" and some others also.
def axis/t="15-JAN-1961":"15-DEC-2000"/np=480/edges tmonthly
def
axis/t="1-JAN-1961:00:00":"31-DEC-2000:00:00"/t0="1-JAN-1961:00:00"/np=480/edges/units=days
tmonthly
etc.
None of them gave what i expected.
I enclose the original daily data set (HU_predaily.gif) and one of the
plots after regriding (HU_premax_tmonthly.gif). The maximum on the
original plot is 33.75 and on the others they are always bigger (around
37).
Can anyone help me?
Thanks in advance,
Peter Szabo