Dear Ferret Users,
Im totally confused about creating appropriate time-axes: i would like to get monthly maximum precipitation from daily data set.
Here are some details of my original data set:
yes? sh axis/t=1-jan-1961:3-jan-1961 tax
name axis # pts start end
TAX TIME 14610 r 01-JAN-1961 00:00 31-DEC-2000 00:00
T0 = 15-JAN-1901 00:00:00
Axis span (to cell edges) = 350640
L T TBOX TBOXLO TSTEP (HOURS)
1> 01-JAN-1961 00:00:00 24 31-DEC-1960 12:00:00 525624
2> 02-JAN-1961 00:00:00 24 01-JAN-1961 12:00:00 525648
3> 03-JAN-1961 00:00:00 24 02-JAN-1961 12:00:00 525672
When i try to find the monthly maximum value through regriding to monthly data with the below command, i just cant have the correct values.
def axis/t="15-JAN-1961":"15-DEC-2000"/np=480 tmonthly
let premmax=pre[gt=tmonthly@max]
I also tried creating the time axis with "/edges" and some others also.
def axis/t="15-JAN-1961":"15-DEC-2000"/np=480/edges tmonthly
def axis/t="1-JAN-1961:00:00":"31-DEC-2000:00:00"/t0="1-JAN-1961:00:00"/np=480/edges/units=days tmonthly
etc.
None of them gave what i expected.
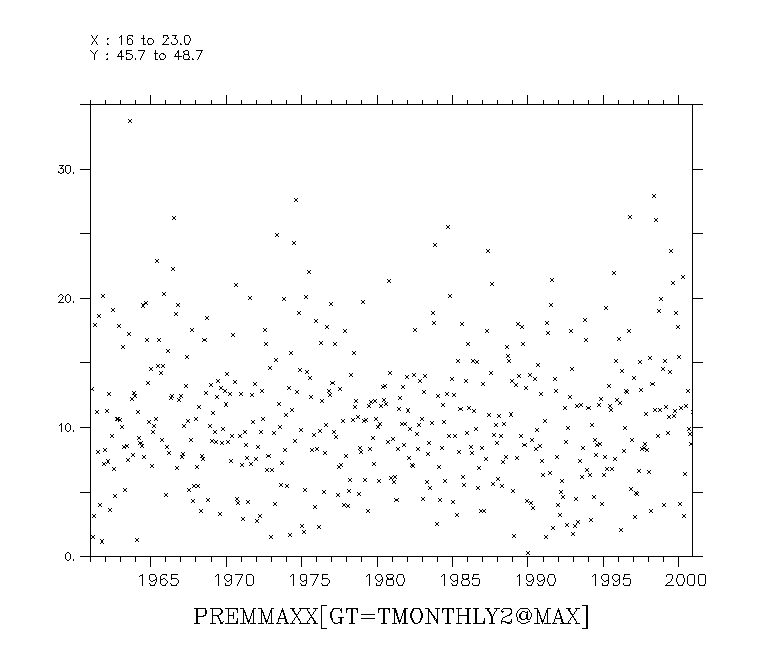
I enclose the original daily data set (HU_predaily.gif) and one of the plots after regriding (HU_premax_tmonthly.gif). The maximum on the original plot is 33.75 and on the others they are always bigger (around 37).
Can anyone help me?
Thanks in advance,
Peter Szabo
Attachment:
HU_premax_tmonthly2.gif
Description: GIF image