Hi
again,
I
generated another netCDF file with fewer points (10-minute interval sampling
from the original data) and Ferret properly recognizes the time axis as
irregular:
> ferret
        NOAA/PMEL TMAP
        FERRET v6.1
        Linux(g77) 2.4.21-32 - 03/25/08
        26-Aug-08 13:11
yes? use "http://dods.mbari.org/cgi-bin/nph-nc/data/ssdsdata/deployments/mse2006/200609/mse2006_ctd_20061106_original.nc"
yes? show grid GAF1
GRID GAF1
name axis # pts start end
LONGITUDE LONGITUDE 1mr 122.89W(-122.89) 122.89W(-122.89)
LATITUDE LATITUDE 1 r 36.237N 36.237N
NOMINALDEPTH DEPTH (m) 1 r- 3450 3450
ESECS TIME 14760 i 06-NOV-2006 01:00 27-APR-2007 23:50
Ferret thinks that the
2-minute interval data is regular:
yes? use "http://dods.mbari.org/cgi-bin/nph-nc/data/ssdsdata/deployments/mse2006/200609/mse2006_ctd_20061106_original_120.nc"
yes? show grid GMH1
    GRID GMH1
 name       axis              # pts   start                end
 LONGITUDE LONGITUDE            1mr   122.89W(-122.89)     122.89W(-122.89)
 LATITUDE  LATITUDE             1 r   36.237N              36.237N
 NOMINALDEPTH DEPTH (m)         1 r-  3450                 3450
 ESECS1    TIME             68919 r   06-NOV-2006 01:00    27-APR-2007 23:48
Seems like Ferret is making
a decision to make the time axis regular even though it's not. Should I
provide some help by adding an attribute of 'point_spacing: "uneven"' to the
time axis definition in the netCDF file?
-Mike
From: McCann, Mike
Sent: Tuesday, August 26, 2008 10:32 AM
To: ferret_users@xxxxxxxx
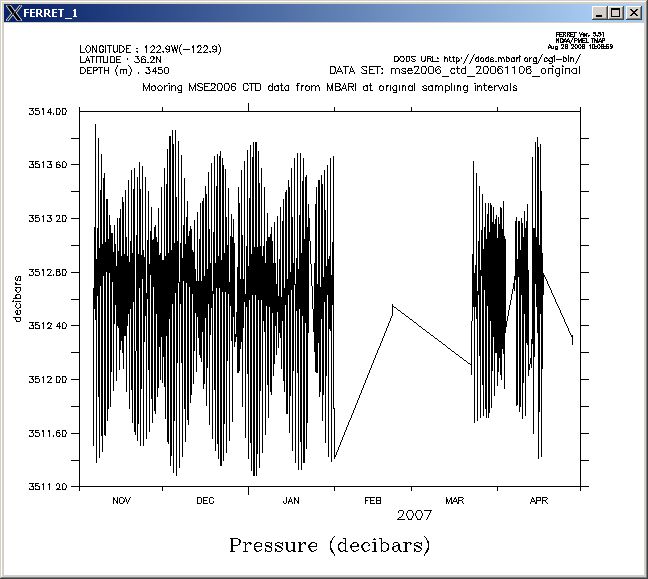
Subject: Error in plotting time series data with 6.1?Hello,We just upgraded to Ferret 6.1 on a Linux host and I'm getting strange results in plotting an irregular time series.Here's the plot with an older version running on my Windows box (plots correctly):bash-2.05$ ferret
NOAA/PMEL TMAP
FERRET v5.51
cygwin 1.3.x - 02/28/03
26-Aug-08 10:06yes? use "http://dods.mbari.org/cgi-bin/nph-nc/data/ssdsdata/deployments/mse2006/200609/mse2006_ctd_20061106_original_120.nc"
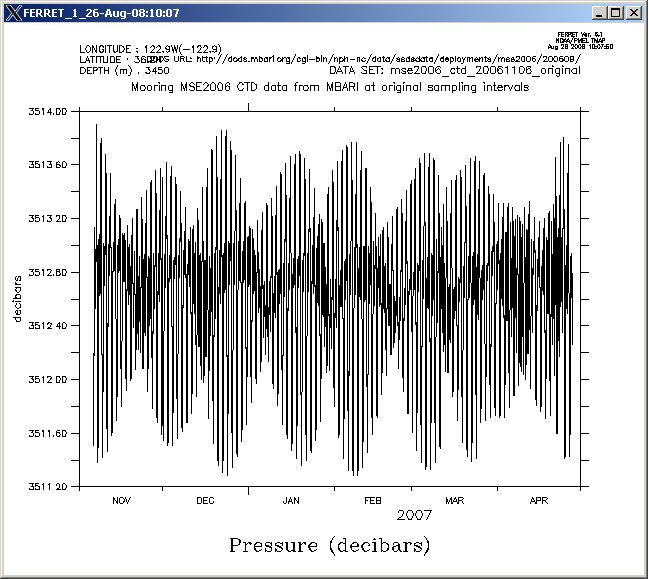
yes? plot PRESSUREHere's the plot with the current release running on my RH Linux (seems to treat the time series as regular) :> ferret
NOAA/PMEL TMAP
FERRET v6.1
Linux(g77) 2.4.21-32 - 03/25/08
26-Aug-08 10:07yes? use "http://dods.mbari.org/cgi-bin/nph-nc/data/ssdsdata/deployments/mse2006/200609/mse2006_ctd_20061106_original_120.nc"
yes? plot PRESSUREAny help or suggestions are appreciated.-Mike--
Mike McCann
Software Engineer
Monterey Bay Aquarium Research Institute
7700 Sandholdt Road
Moss Landing, CA 95039-9644
Voice: 831.775.1769 Fax: 831.775.1736 http://www.mbari.org