[Thread Prev][Thread Next][Index]
Re: [ferret_users] how to find the stations near a line between two points
Hi Murat,
   Here is something that might work for you.
Good luck,
   Mick
-------------
Step 1 : Define a set of closely spaced points along the great circle
joining the start and end points of your section. This can be done using
the attached script "greatcircle.jnl" as in the demo. Here (lon1,lat1)
and (lon2,lat2) are the start and end points of the section.
Step 2 : Write the great circle points (lon,lat) to a file then read
them back TO REDEFINE (lon1,lat1). I'd suggest reading them to a grid
axis not otherwise used in the analysis. (Suppose you use the t-axis!)
Step 3 : Redefine (lon2,lat2) to be the positions of your CTD stations.
The question now is whether the MINIMUM greatcircle distance from one of
those sites to the CURVE (lon1,lat1) is less than your required
threshold (10km). You can check this using gckm[L=@min].
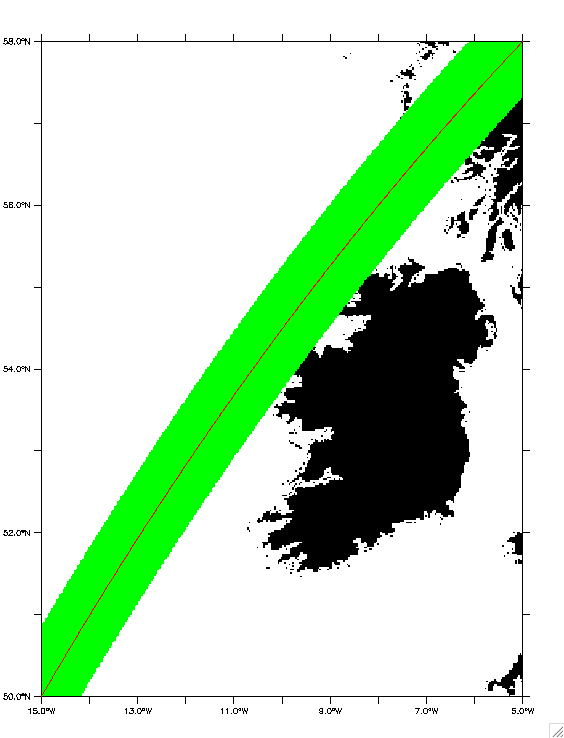
So here is a demo. Suppose I want to identify grid points in the
Smith-Sandwell bathymetry that are within 50km of the great circle
between (345E,50N) and (355E,58N).
! make the great circle definitions
go greatcircle
! define the section end points
let lon1=345 ; let lat1=50 ; let lon2=355 ; let lat2=58
! define a closely-spaced grid of points between LON1 and LON2 ...
def axis/t=345:355/npoints=1001 tsect ; def grid/t=tsect gsect
let lon=t[g=gsect] ! the corresponding "lat" for a point on the
greattcircle comes from the "greatcircle.jnl" script
! ... and list (lon,lat) to a file
list/nohead/form=(2f11.5)/file=MySection.coords lon,lat

! read back these points to replace the definitions of lon1,lat1
file/form=free/var=xx,yy/g=gsect  MySection.coords
let lon1=xx[d=MySection.coords] ; let lat1=yy[d=MySection.coords]
! define the points to be tested for closeness to the section ; I'm
going to use the grid points of a bathymetry file
! In your case Murat you would probably read these points (lon2,lat2)
from a file!
use smith_sandwell_topo.cdf
let lon2=x[g=rose]+0*y[g=rose]
let lat2=0*x[g=rose]+y[g=rose]
! FINAL STAGE Shade a strip within 50km of the section linking (345,50)
to (355,58)
shade/nolab/nokey/pal=black/x=345:355/y=50:58 if(rose ge 0)then 1
! color grid cells of bathy file within 50km of the great circle section
shade/o/nolab/pal=green/x=345:355/y=50:58 if(gckm[L=@min] lt 50)then 1
! and overlay the section itself
plot/o/vs/nolab/line=2 lon1,lat1
The result is shown in the attached graphic. In your case the final
stage might be something like this:
file/form=free/var=lon2,lat2 MyCTDs.coords
let mask=if(gckm[L=@min} le 10)then 1 else 0
list/nohead lon2,lat2,mask
where CTDs you need to include in the section plot are identified by
"mask=1".
Murat Gunduz (Contractor) wrote:
Hi Ferret Users,
I have a spatially scatter ctd profiles, I would like to make a
vertical section from this data set by
given the beginning and ending coordinate of the vertical section (i.e
line).
my question is,
how can I find the ctd stations near this line (let say, stations
which are 10km away from this line)?
are there anyone made such a script?
After finding the stations (i.e the latitude and longitude values)
which are near this line,
I can easily make section plots as defined here.
8.3.3 Defining vertical sections from profiles


Thank you very much in advance,

Murat
! greatcircle : definitions for great circle calculations between
!               two locations lon1,lat1 and lon2,lat2 (in degrees)
!
let d2r=atan(1.)/45
let rlon1=d2r*lon1 ; let rlat1=d2r*lat1
let rlon2=d2r*lon2 ; let rlat2=d2r*lat2

! define great circle distances from lon1,lat1 to lon2,lat2 in radians ...
let/title="Great Circle Distance (radians)" \
   gcrad=acos(sin(rlat1)*sin(rlat2)+cos(rlat1)*cos(rlat2)*cos(rlon2-rlon1))
! ... and kilometers
let/title="Great Circle Distance (km)" gckm=111.11*gcrad/d2r
let/title="Great Circle Distance (nm)" gcnm=60*gcrad/d2r

! define initial heading from lon1,lat1 to lon2,lat2 (clockwise from north)
let gcharg=acos((sin(rlat2)-sin(rlat1)*cos(gcrad))/(sin(gcrad)*cos(rlat1)))
! correct for near north-south pairings
let gchfix=gcharg[x=@fln]/d2r
let/title="Initial Heading (degrees)" \
   gchead=if(sin(rlon2-rlon1) gt 0)then gchfix else 360-gchfix

let lat=atan((tan(d2r*lat2)*sin(d2r*(lon-lon1))-tan(d2r*lat1)*sin(d2r*(lon-lon2)))/ \
   sin(d2r*(lon2-lon1)))/d2r

! Usage: the results "gcrad", "gckm", and "gchead" are computed based on
!        existing variables lon1,lat1 representing the start point and
!        lon2,lat2 representing the destination.
!
! NOTE : To plot a greatcircle from lon1,lat1 to lon2,lat2 define a variable "lon"
!        that spans the interval between them with sufficient resolution, for example
!               def axis/x=`lon1`:`lon2`:0.1 xax ; let lon=x[gx=xax]
!               plot/o/vs/nolab/line=2 lon,lat
!        If a gridded file such as a topography is available it may be convenient to
!        use that x-axis for "lon":
!                       let lon=x[g=...]
!               plot/o/vs/nolab/line=2/x=`lon1`:`lon2` lon,lat
!

[Thread Prev][Thread Next][Index]
Contact Us
Dept of Commerce /
NOAA /
OAR /
PMEL /
TMAP
Privacy Policy | Disclaimer | Accessibility Statement
