[Thread Prev][Thread Next][Index]
Re: [ferret_users] custom tick mark label
Hi Tulay,

   Here is something that may work for you:

1) turn off the regular time axis labels with "ppl txlabp,0"
2) draw your stick vectors with "go stick_vectors ..."
3) create a variable with your month names (I added the english ones
past those you provided)
let
months=xsequence({"ocak","subat","@mart","apr","may","jun","jul","aug","sep","oct","nov","dec"})
4) use the label/nouser command in a repeat loop to evenly space the
month labels along the axis. In the
following I've assumed the horizontal axis is the default 8 inches long
repeat/i=1:12 (label/nouser `(i-0.5)*8/12` -0.4 0 0 0.15
@sr`months`)
For a demo I'll just do a regular plot rather than a stick plot -- the
principle is the same. Note that the
same procedure would work to add a different number of evenly spaced
labels along any horizontal
axis. A few other points to note in the label command of the demo:
a) the 12 is for the twelve months you need - for multiyear or partial
year you'd make it something else
b) the -0.4 is the distance in inches below the horiz axis to draw the
labels - alter it to suit
c) the 0.15 is the month label height in inches - again change it as needed
d) note the use of back quotes (`) in the label/nouser command which
inserts the variable values
Hope this helps,
Mick
PS Since this month includes St.Patrick's Day I adjusted the color of
"mart" appropriately in its demo
label. You could embed other formating characters in the defined labels
(font change, superscript/subscript, ...)
in a similar way.
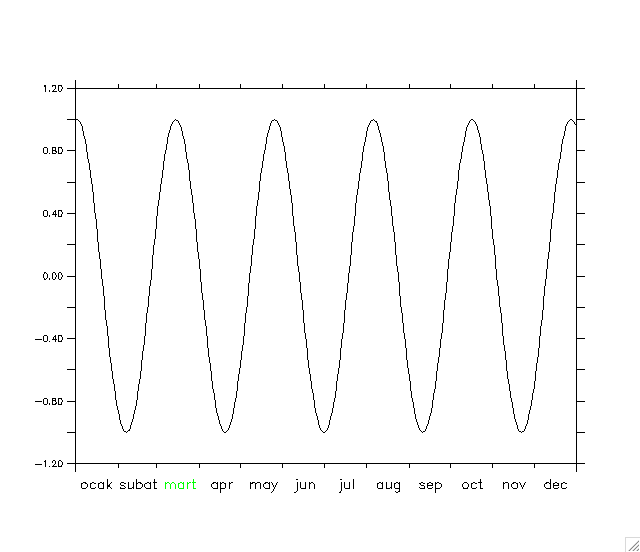
! demo of alternate language month labeling
def axis/t="1-jan-2003":"31-dec-2003":1/units=days tax
def grid/t=tax grd
! make a demo variable to plot
let d2r=atan(1.)/45 ; let v=sin(5*d2r*t[g=grd])
! turn off the time axis labeling ... and plot it
ppl txlabp,0 ; plot/nolab v
! now define your month labels
let
months=xsequence({"ocak","subat","@p3mart","apr","may","jun","jul","aug","sep","oct","nov","dec"})
! ... and draw them
repeat/i=1:12 (label/nouser `(i-0.5)*8/12` -0.4 0 0 0.15 @sr`months`)


Tulay Cokacar wrote:
Hi,

I need help to change tick mark labels of a plot. Below comment plots
tick mark labels  as "Jan Feb Mar ...". I need to replace them either
numeric values as "1  2  3 .." or much better to my language words as
"ocak subat mart ...".
go stick_vectors plot/NOLABELS/color=red/t="1-jan-2003":"31-dec-2003"
uwnd,vwnd


Tulay
[Thread Prev][Thread Next][Index]
Contact Us
Dept of Commerce /
NOAA /
OAR /
PMEL /
TMAP
Privacy Policy | Disclaimer | Accessibility Statement