There are a family of scripts that does this, or almost.
yes? go/help gridxy
So, try this:
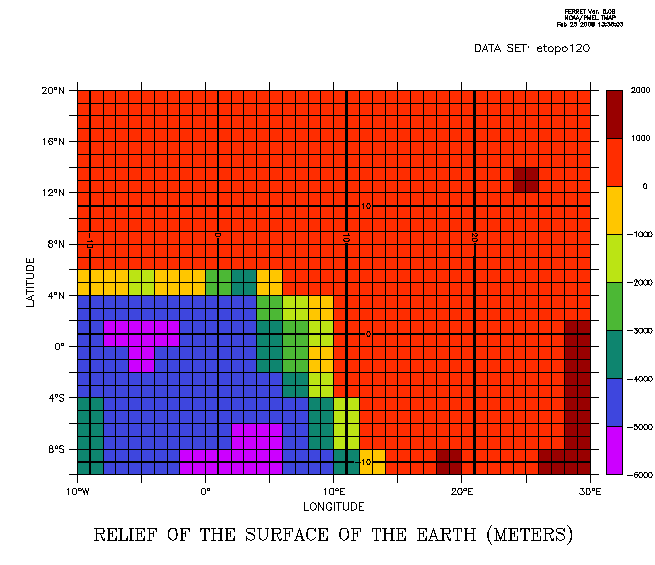
yes? use etopo120However it makes lines at the grid points, not the edges. And if the X axis is a modulo axis, and the plot crosses the end of the axis as it's defined, then some of the plot is unmarked by the grid.
yes? shade/x=30:60/y=0:20 rose
yes? go gridxy
yes? use etopo120Here's an example of a simple script that defines variables based on xboxlo and ybolxo to get the outlines of the grid boxes. With a little work it could be made more general to overlay a grid on any plot. See if it's enough to get you started.
yes? shade/x=0:20/y=0:20 rose
yes? go gridxy
use etopo120
shade/x=-10:30/y=-10:20 rose
! Define variables with the box outlines. If x is a modulo axis, define its range explicitly.
yes? let xx = xboxlo[gx=rose,x=-15:33]
yes? let yy = yboxlo[gy=rose]
! Contour with levels set a bit outside the range of the plot
! so we get all the edges.
! Set the levels to draw every degree, unlabeled,
! and every 10 degrees, dark lines with labels.
!
! (-20,40,1,-3) every degree, -3 means no label
! LINE(-20,40,1) solid lines at all levels (default is dash for negative values)
! (-20,40,10,-1) every 10 degrees, -1 means integer labels
! DARK(-20,40,10) Make the 10-degree contours dark lines.
! Vertical lines at each x edge
contour/over/nolab/color=black/lev=(-20,40,1,-3)(-20,40,10,-1)LINE(-20,40,1)DARK(-20,40,10) xx+(yy*0)
! Horizontal lines at each y edge
contour/over/nolab/color=black/lev=(-30,40,1,-3)(-30,40,10,-1)LINE(-30,40,1)DARK(-30,40,10,-1) yy+(xx*0)
(Also see the script mask_outline.jnl for some related ideas)
Ansley
Ashley Watson wrote:
Hi ferreters,
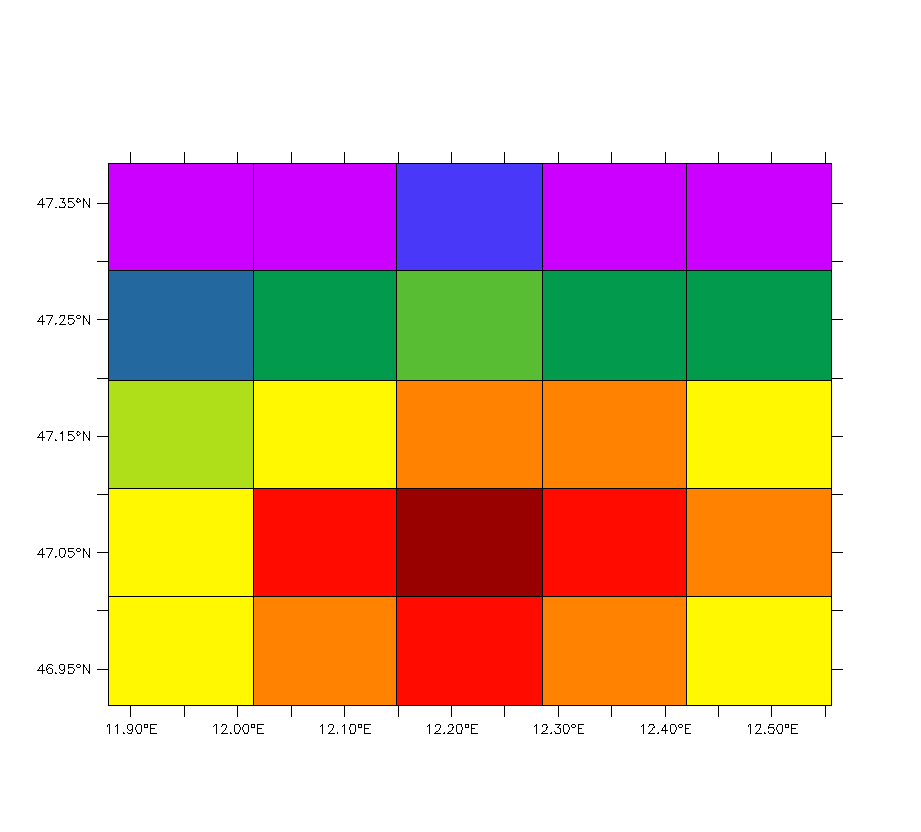
I want to draw straight lines at grid boundries to separate my gridboxes (see attached figure). I have done this by noting the values of
XBOXLO and YBOXLO corresponding to gridboxes and then drawing straight lines at these values using POLYGON command. Is there any way to
draw these lines using I, J indices rather than X,Y values??
Here are commands I used to draw the lines:
yes? show data
currently SET data sets:
1> HEAD_OUT.NC (default)
name title I J K L
HT Elevation 1:150 1:89 ... 1:1
set reg/I=62:66/J=43:47
Let YT1 = {47.012,47.012,47.105,47.105,47.198,47.198,47.292,47.292} !horizontal lines (ypts)
Let XT1 = {11.87927,12.55549,12.55549,11.87927,11.87927,12.55549,12.55549,11.87927} !horizontal lines(xpts)
Let YT = {46.919,47.384,47.384,46.919,46.919,47.384,47.384,46.919} !vertical lines (ypts)
Let XT = {12.01452,12.01452,12.149,12.149,12.285,12.285,12.42,12.42} !vertical lines (xpts)
shade ht
POLYGON/nolab/over/color=1/thick=1.1 xt, yt, 0
POLYGON/nolab/over/color=1/thick=1.1 xt1, yt1, 0
Thanking in Anticipation
Ashley