We're working on a new function for Ferret which will compute a flag, based for whether points are within a polygon defined by a set of vertices. This has come up before, and there are good algorithms for solving it, for instance a search in Wikipedia or Google code-search for "Point in Polygon" turns up a number of good discussions.
Ansley
IMRAN NADEEM wrote:
Hi Ansley, Jaison and Mick,
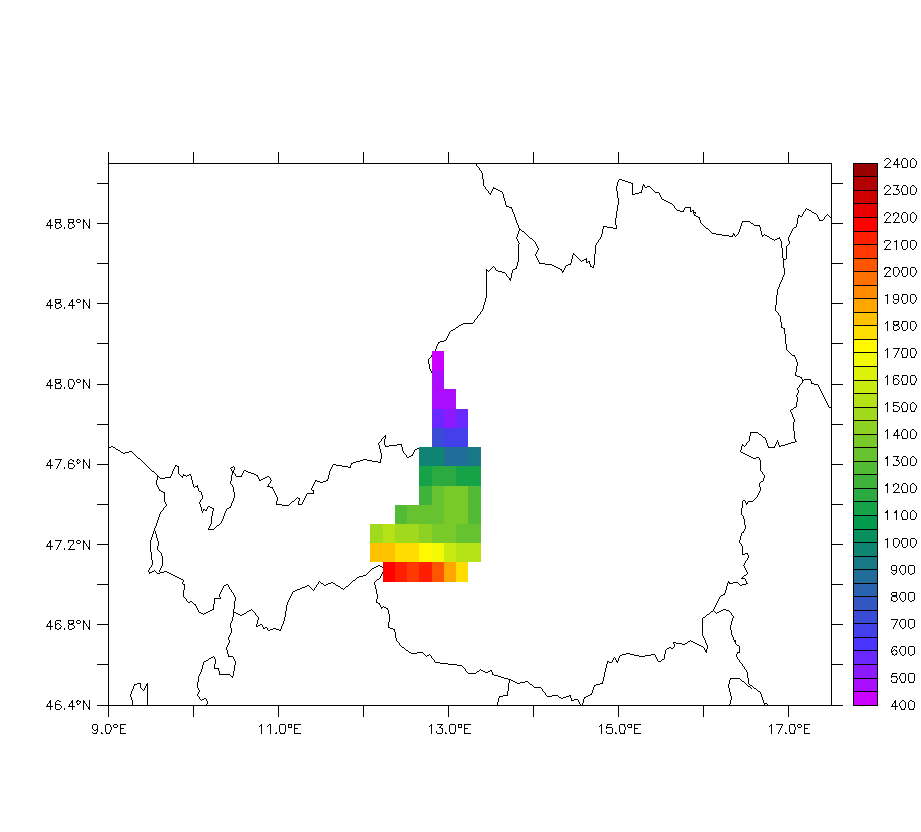
I really appreciate your help on my problem. I did some analysis on a catchment (irregular region) shown in the attached figure. I used the method as suggested by
Ansley and Jaison. I prepared mask of the region by "visual editing" but this method requires lot of if-statements. For single region "visual editing" is not a bad option but
for mulitple regions the method described by Mick is better and it also requires less work.
Once again thanks for your help
Imran
On Jan 2, 2008 10:44 PM, mick spillane < Mick.Spillane@xxxxxxxx> wrote:
Hi Imran,
It looks like the colored region in your image is a 40x15 regular
grid. If the data you want to analyze are on the same grid then you
have a problem similar to one I looked at some time ago.
Step 1: Using vi or some other editor make a text file matching your
domain, and with 0,1,2,3,4,5 representing missing, blue, orange,
yellow, red, green. I get something like this, but you ought to check it:
3333333333334444444444444444455555555555
3333333333344444444444444444455555555555
3333333333344444444444444444445555555555
3333333333344444444444444444444555555555
3333333333333444444444444111111555522222
3333333333333333444444111111111511122222
3333333333333311111111111111111111122222
3333333333331111111111111111111111222222
3333333331111111111111111111111112222222
3333333111111111111111111111111122222222
0333311111111111111111111111122222222222
0033111111111111111111111111122222222222
0011111111111111111111110001122222222222
0111111111111111111111100000002222222222
0111111111100000011110000000000222222222
Step 2: Ferret likes to read data from south to north, so you need to
reverse the order of this file "nadeem.step1"
On my Mac I can do this with
tail -r nadeem.step1 > nadeem.mask
and the file nadeem.mask then looks like
0111111111100000011110000000000222222222
0111111111111111111111100000002222222222
0011111111111111111111110001122222222222
0033111111111111111111111111122222222222
0333311111111111111111111111122222222222
3333333111111111111111111111111122222222
3333333331111111111111111111111112222222
3333333333331111111111111111111111222222
3333333333333311111111111111111111122222
3333333333333333444444111111111511122222
3333333333333444444444444111111555522222
3333333333344444444444444444444555555555
3333333333344444444444444444445555555555
3333333333344444444444444444455555555555
3333333333334444444444444444455555555555
Step 3: Read this mask file into Ferret
def axis/x=1:40:1 xin ; def axis/y=1:15:1 yin ; def grid/x=xin/y=yin gin
file/form=(40f1.0)/col=40/var=mask/g=gin nadeem.mask
Step 4:
If your data are on a 40x15 grid "grd" but with actual lon,lat axis
values you need to "regrid with assignment" the mask read in above to
match the data grid:
let msk=mask[g=grd,gx=@asn,gy=@asn]
This "assigns" the mask we created on-to-one to the data grid. If the
data grid is bigger than the colored region, you should add a margin of
"0" values around the ASCII file and adjust the values (40 and 15)
appropriately. The zero value will be used as missing value.
shade msk ; frame/file=nadeem1.gif
Step 5: Evaluating statistics in the colored regions. If you have a
variable v and need its average over the blue region for example then
you might define:
let pick=if(msk eq 1)then v
list pick[x=@ave,y=@ave]
and likewise for the other regions 2,3,4,5 in turn.
Since I don't have your data, and don't know exactly what your data grid
is, here is a demo with a fake variable v
let v=sin(x[g=gin]/5)*cos(y[g=gin]/3)
shade v ; frame/file=nadeem2.gif
Then
repeat/k=1:5 (let pick=if(mask eq `k`)then v ; list/nohead/form=(f10.4)
pick[x=@ave,y=@ave] ; message )
gives the following averages in regions 1-5: 0.1776 -0.1108
-0.3975 0.1717 -0.1398
Attached find images of the mask, the demo variable, and the variable
masked for region "A" in your image.
Hope this helps but, in any case, happy ferreting in 2008.
Mick Spillane
>> ------------------------------------------------------------------------
Ansley Manke wrote:
> Hi Imran,
> If you can come up with a way to define your region with a variable
> that's 1 inside the region and 0 outside the region, then you can use
> a MASK to do analysis on data in that region. Here is an FAQ with some
> examples of this.
>
>
> http://ferret.pmel.noaa.gov/FERRET_17sep07/FAQ/analysis/avg_integ_irreg.html
>
> Ansley
>
> IMRAN NADEEM wrote:
>> Hi all,
>>
>> I want to do some analysis on irregular regions shown in the
>> figure. Can anybody help me to make mask for such irregular regions.
>>
>> Regards
>> Imran
>>
>>
>>
>>
>>
>>
